Use case
Context
Repeated irrigation maps share many layer, style and layout decisions.
Problem
Changing map extents and output settings manually can produce inconsistent projects.
Workflow
Select an area and settings, build a QGIS project through XML, then render and review separately.
Public example
The example uses NLSC open geographic data. No internal maps or operational data are published.
Configuration and project generation
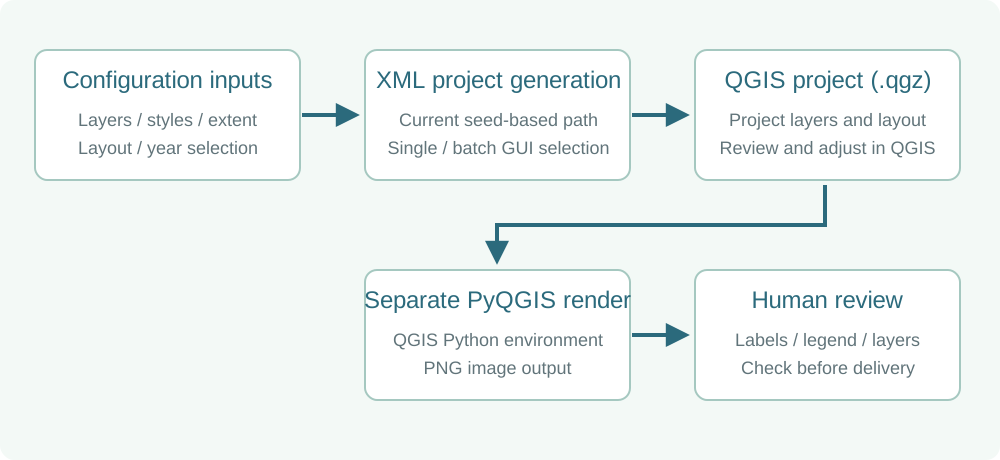
The current generator offers single and batch selections through a desktop GUI. Its production path edits a seed-based QGIS project through XML: it selects layers, applies configured styles, sets the map extent and rebuilds layout components. Rendering is a separate step using the QGIS Python environment.
Before / after on the same geographic extent
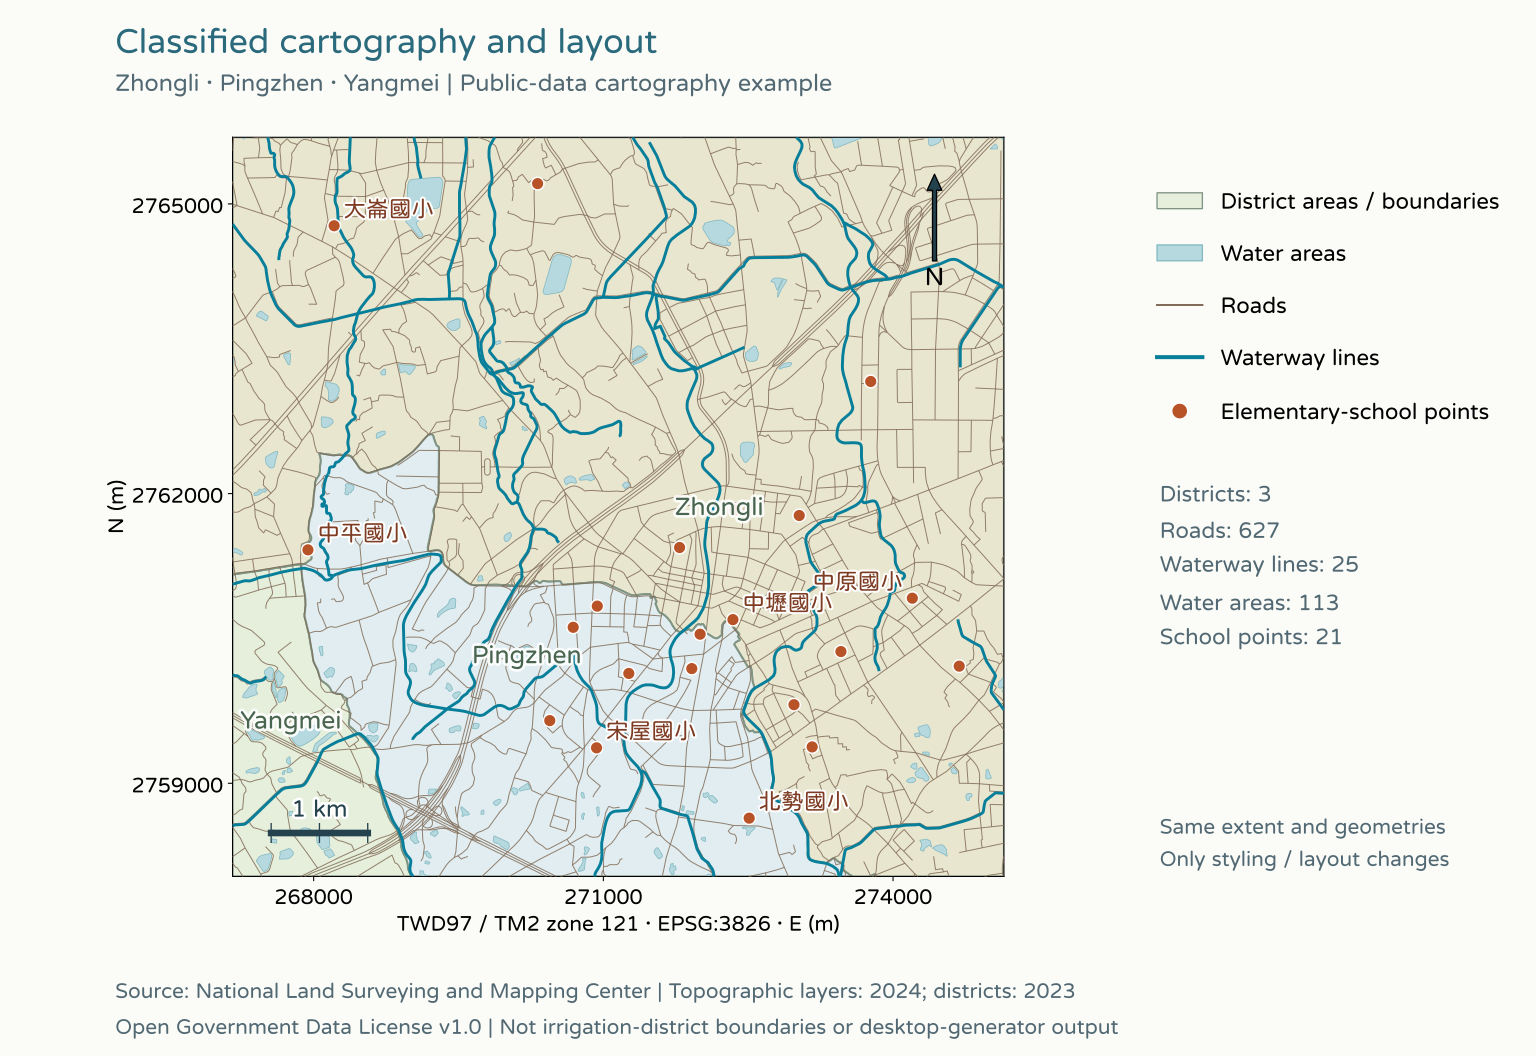
Public-data cartography example: district areas, roads, waterways and elementary-school points. NLSC topographic layers from 2024 and district boundaries from 2023 are clipped to the same extent in TWD97 / TM2 (EPSG:3826). Both states keep identical geometries; only styling, labels and layout change. This independent example is not a screenshot or output of the desktop generator, or an official irrigation-district map.
Layer recognition
Neutral input styling becomes distinct district areas, water areas, roads, waterways and school points.
Line and point hierarchy
Blue waterways stand out from finer road lines. School points stay above both line and area layers.
Labels and legend
A few well-spaced school names receive text halos. The classified legend sits outside the map frame.
Layout information
A 1 km scale bar and grid north supplement the same projected coordinate frame. Both states retain data dates and attribution.
Public sources and license
Attribution: National Land Surveying and Mapping Center (NLSC), Ministry of the Interior. The topographic sheet is Zhongli, 2024; district boundaries are the 2023 file version. Derived under the Open Government Data License v1.0. Administrative boundaries are not irrigation boundaries, not every waterway is an irrigation canal, and school points do not establish public ownership.
NLSC open-data downloads · Topographic dataset · District boundaries · Open Government Data License v1.0
Project and rendering outputs
QGIS project
The project-generation stage produces a .qgz project containing configured layers, styles and layout settings.
Optional rendering
A separate PyQGIS rendering stage exports PNG images for review. Project generation itself does not require PyQGIS.
Cartographic review
Review layer completeness, canal classes, map extent, label placement and legend overlap before delivery.
Configuration reuse
Year and source selections, style specifications and layout settings support repeatable setup across selected cases.
Implemented scope and remaining work
- The existing GUI supports single/batch selection and configurable layer, orientation and layout options.
- The implemented main path remains seed-based XML project generation. A from-scratch builder exists separately and is not integrated into the GUI.
- Layer coverage and canal-class mapping are incomplete; legend avoidance and label direction/overlap still need review.
- This public page is an anonymous explanation and public-data cartography demonstration. It is not evidence of all districts being complete, nationwide operation or quantified time savings.
Scope is grounded in the implementation and architecture records. Original code, source datasets, internal locations and private repositories are not distributed here.