Smart Mobility · GIS Feasibility Study

Qingpu Autonomous Shuttle Feasibility Analysis

From demand identification to route planning — a systematic assessment and implementation strategy for autonomous shuttles

GIS spatial analysisOperational design domain assessmentPOI demand weightingShuttle route planning

Project background

Qingpu, Taoyuan combines several conditions that make it a promising setting for an autonomous shuttle demonstration.

Smart-city demonstration area

Taoyuan's smart-city initiatives identify Qingpu as a key development area, with established infrastructure and a newly planned urban setting.

Multimodal transport hub

Taoyuan HSR Station and the Airport MRT form a regional transport hub, while gaps remain in last-mile access.

Concentrated commercial destinations

Major destinations including IKEA, Xpark, Gloria Outlets and Cathay Landmark generate substantial travel demand.

Rapid population growth

Many new housing developments in Qingpu have recently been occupied. The study identifies population growth outpacing expansion of the bus network, increasing the need for last-mile connections.

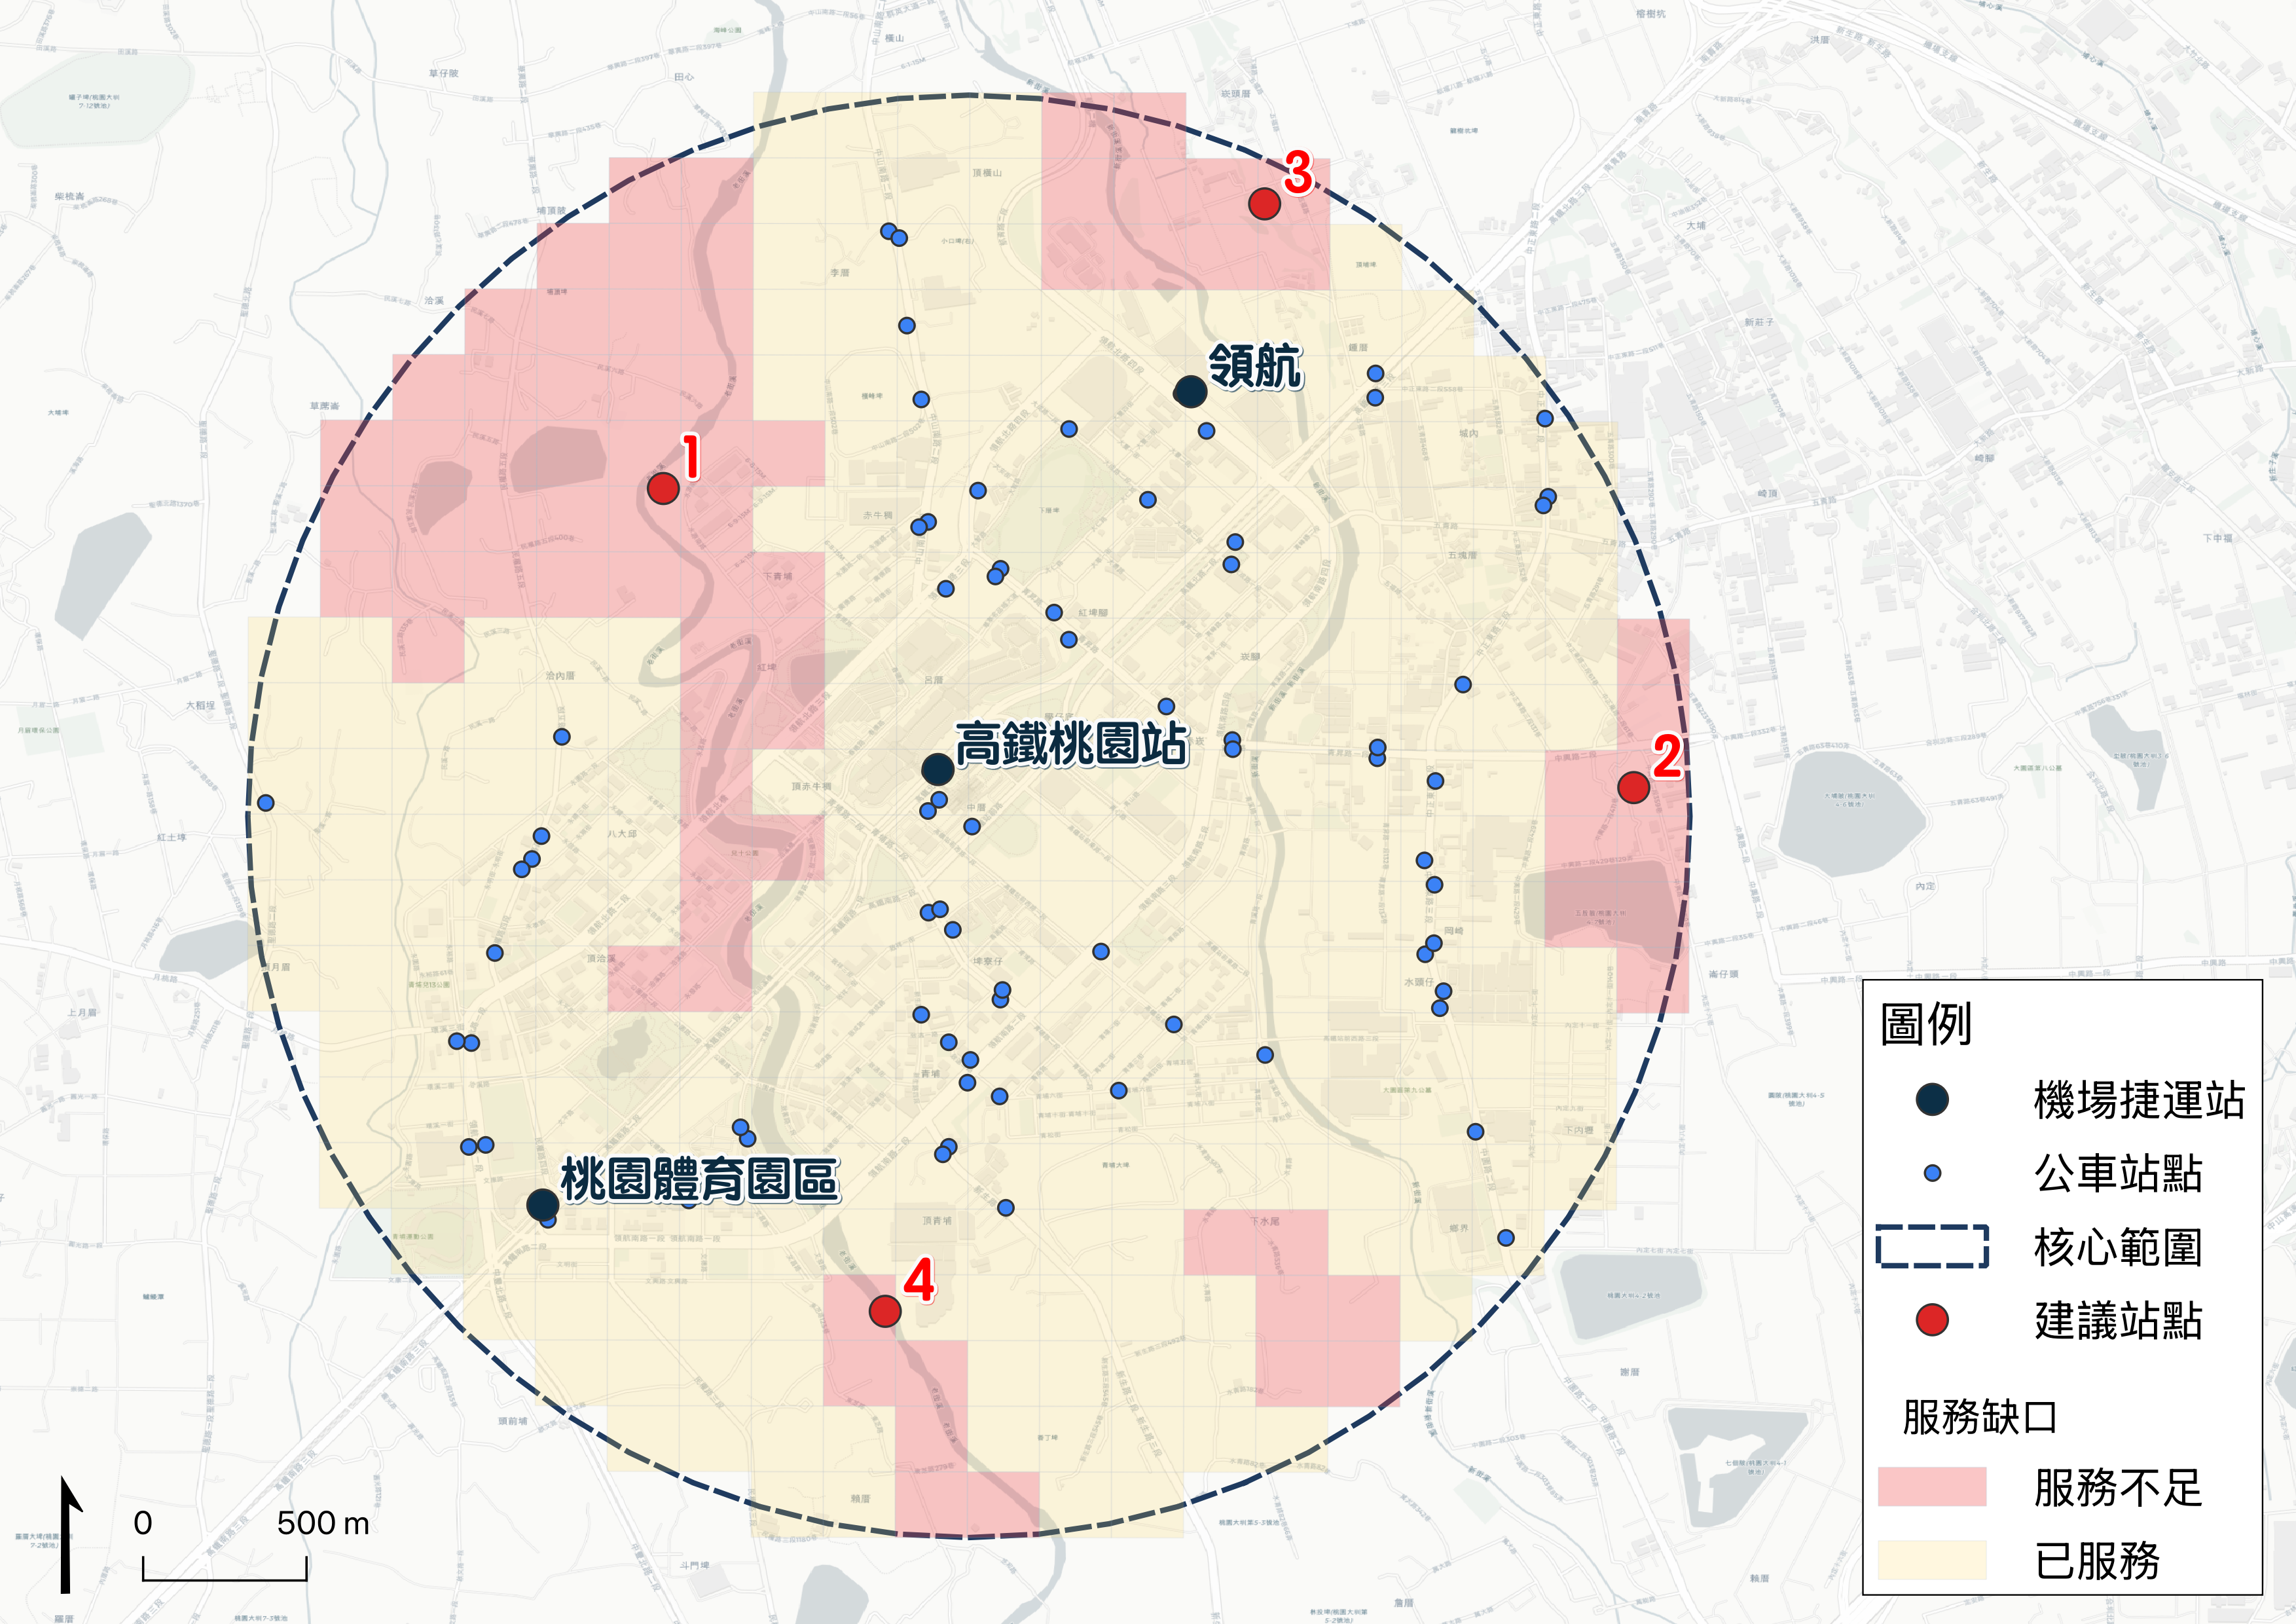
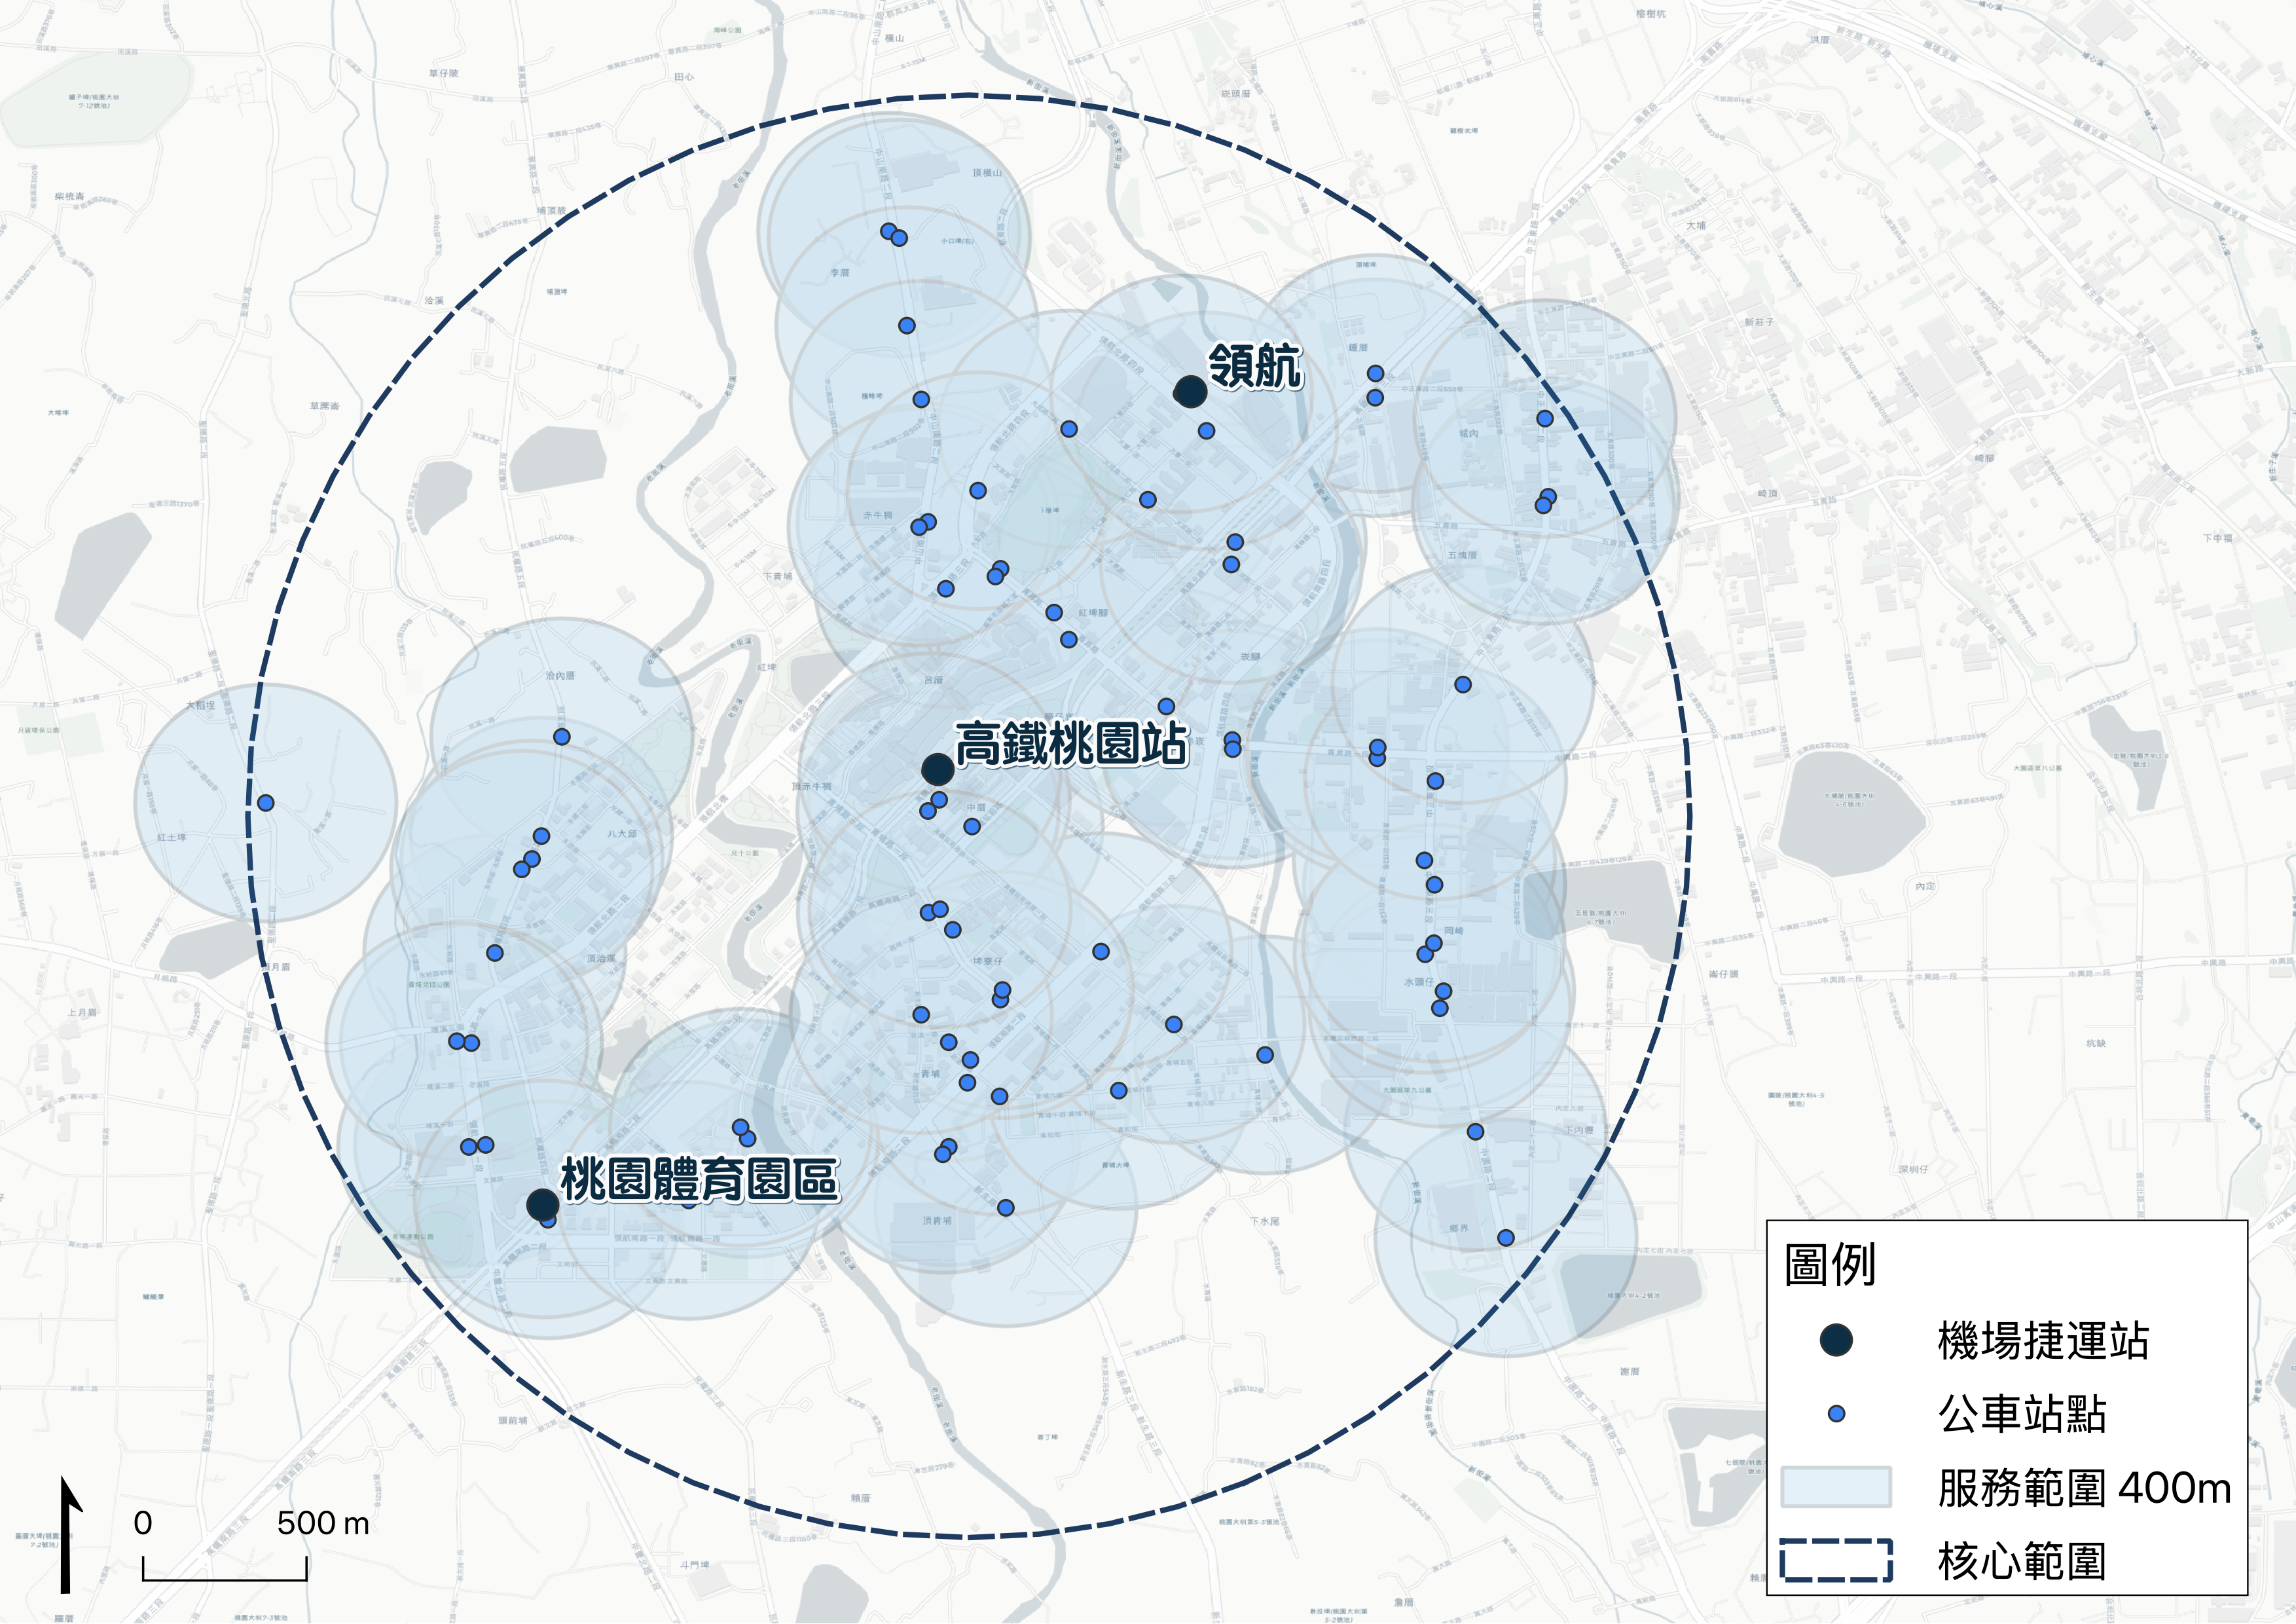
Core analysis area — using Taoyuan HSR Station, with a radius of 2 km. The circular study area contains 3 rail stations, including Linghang and Taoyuan Sports Park, and 74 bus stops.
Core issue: within this area, 400m bus-stop buffers cover 77.9%, while 22.1% of the area lies more than 400 metres from the nearest bus stop, creating a public-transport last-mile access gap.

Project development logic

Four steps address the central planning questions: why the service is needed, where it should operate, how to design it and how to implement it.

Step 1 — Establish demand
Who needs the service, and why?
The core study area is a 2km-radius circle around Taoyuan HSR Station. Buffers of 400m around 74 bus stops quantify the coverage gap.
22.1% of the area lacks bus-stop coverage
Insufficient service coverage
Service gap
Step 2 — Locate the gaps
Where are the specific gaps?
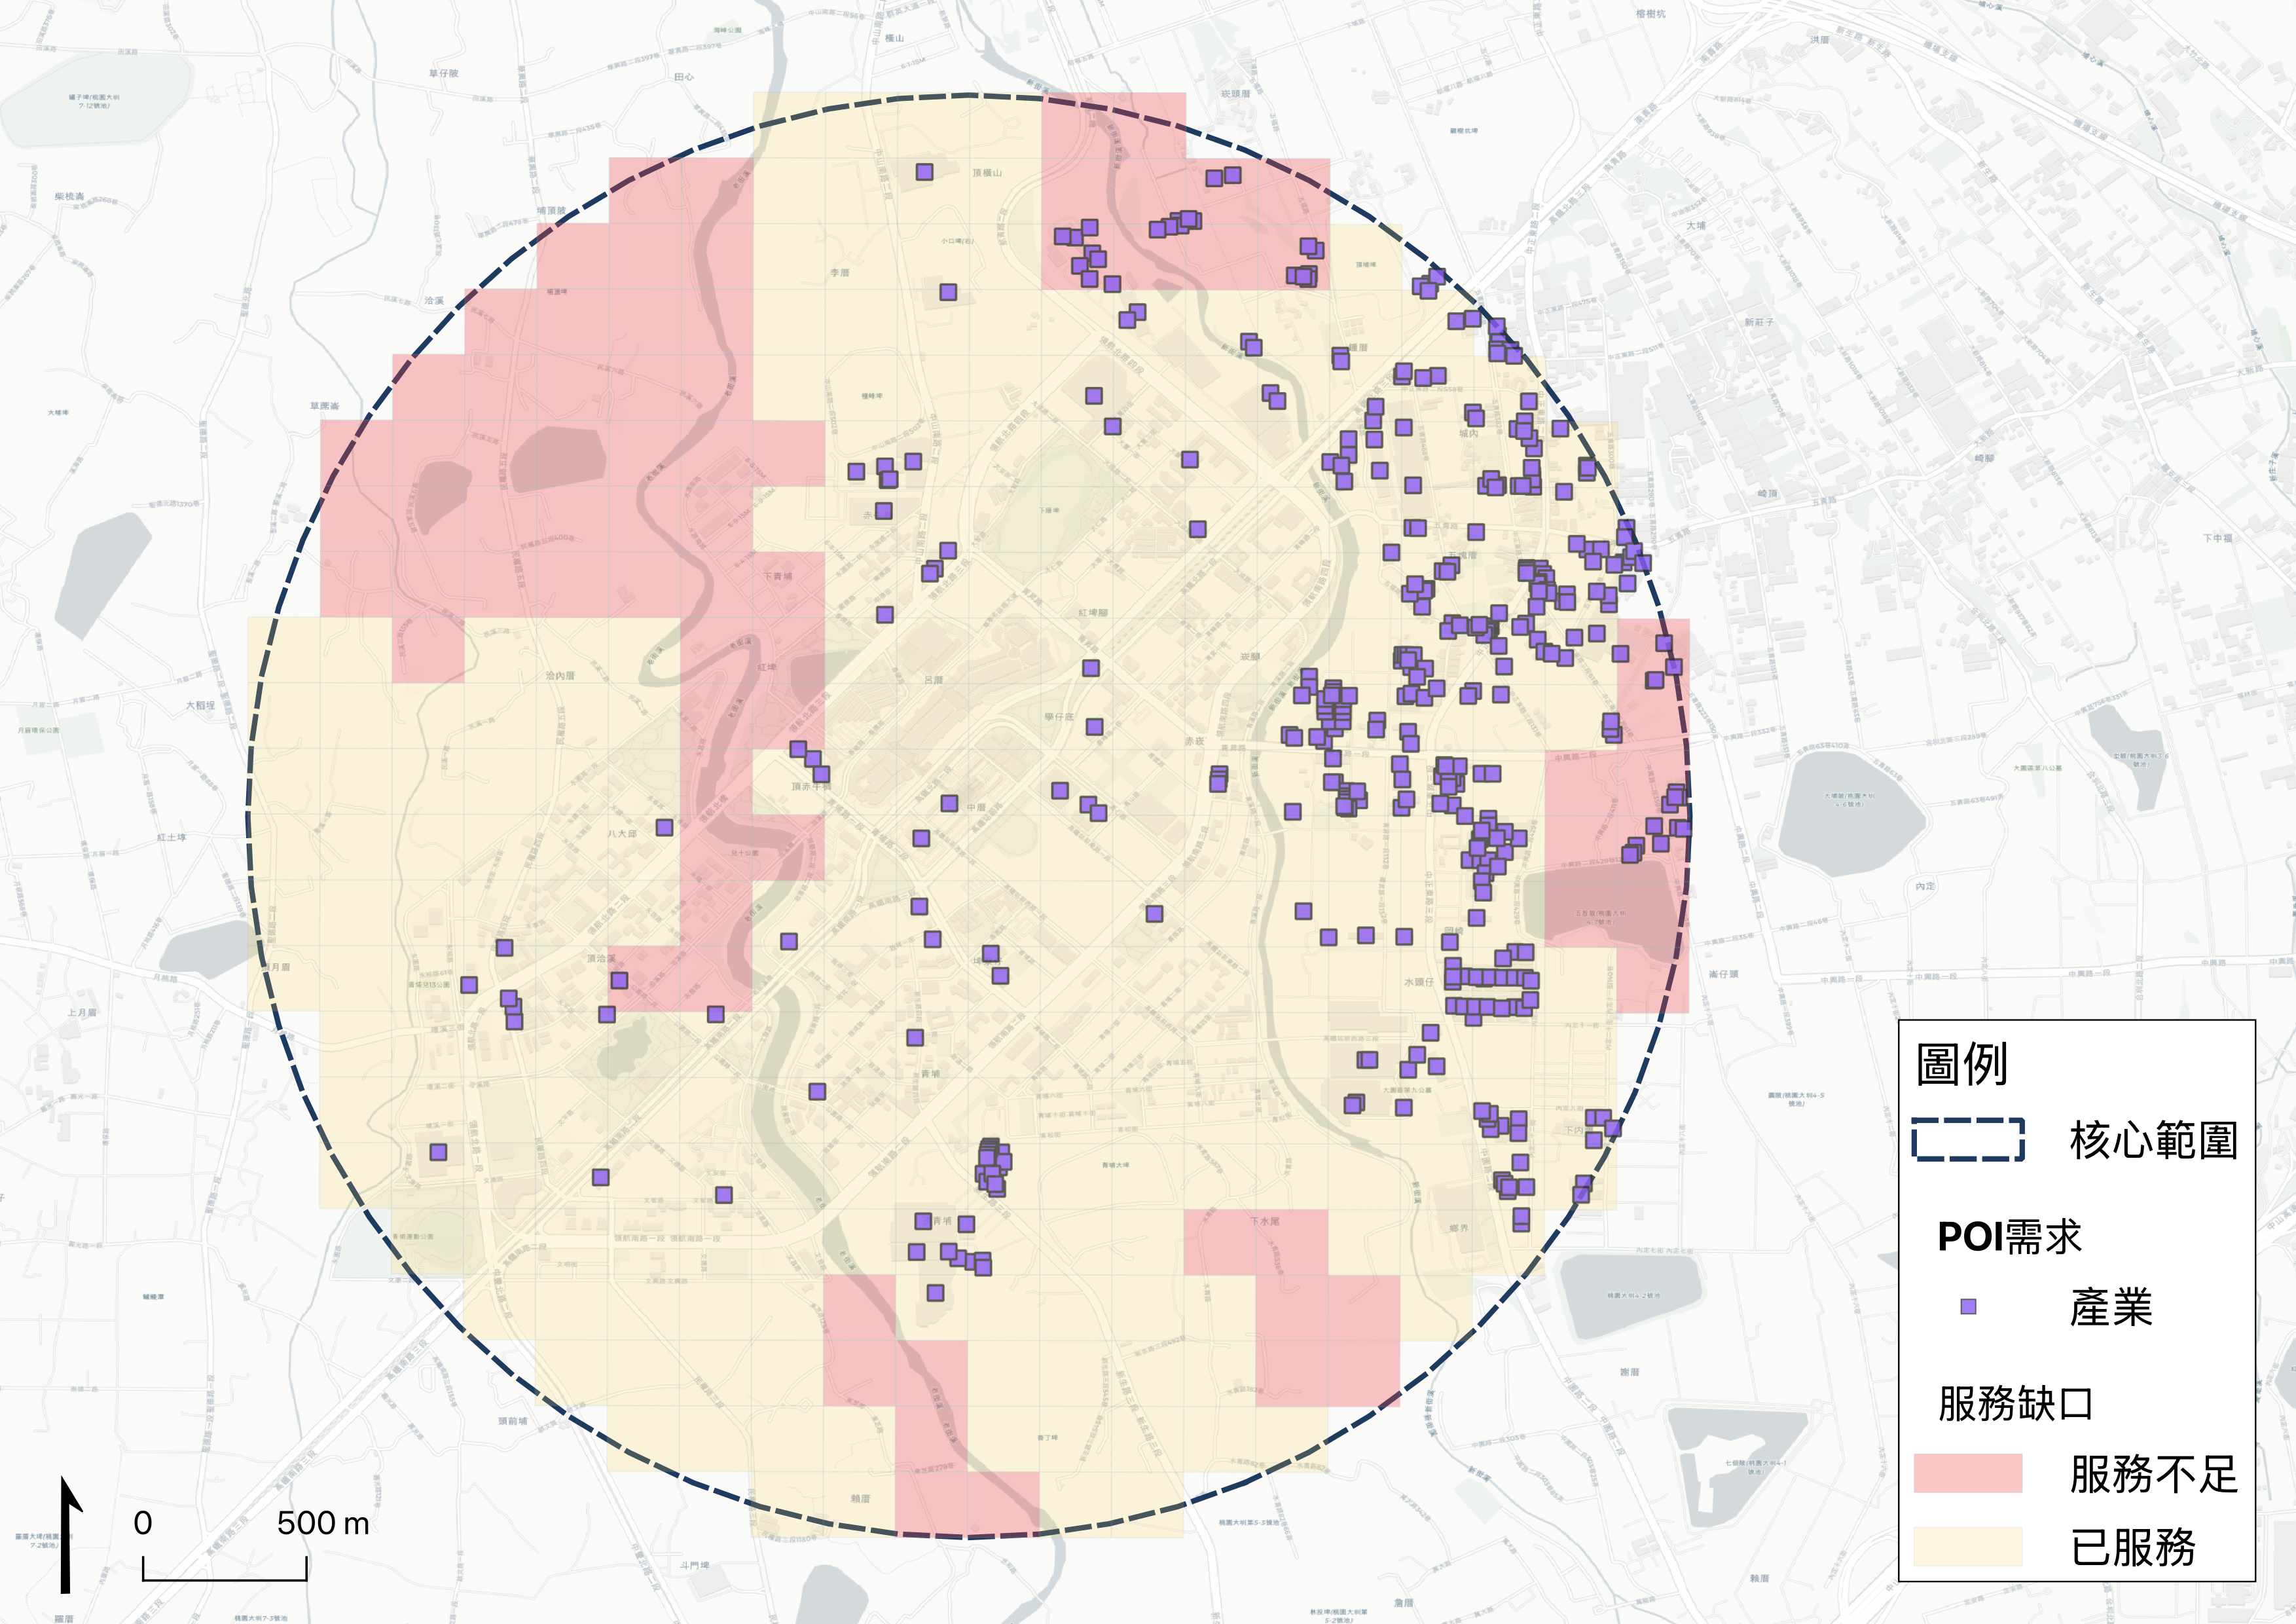
A 200m grid identifies uncovered parts of the core area. Residential and employment POIs are overlaid, and demand-density weighting informs 4 proposed stop locations.
4 clusters of gaps with concentrated demand
Step 3 — Assess feasibility
Can an autonomous vehicle operate here?
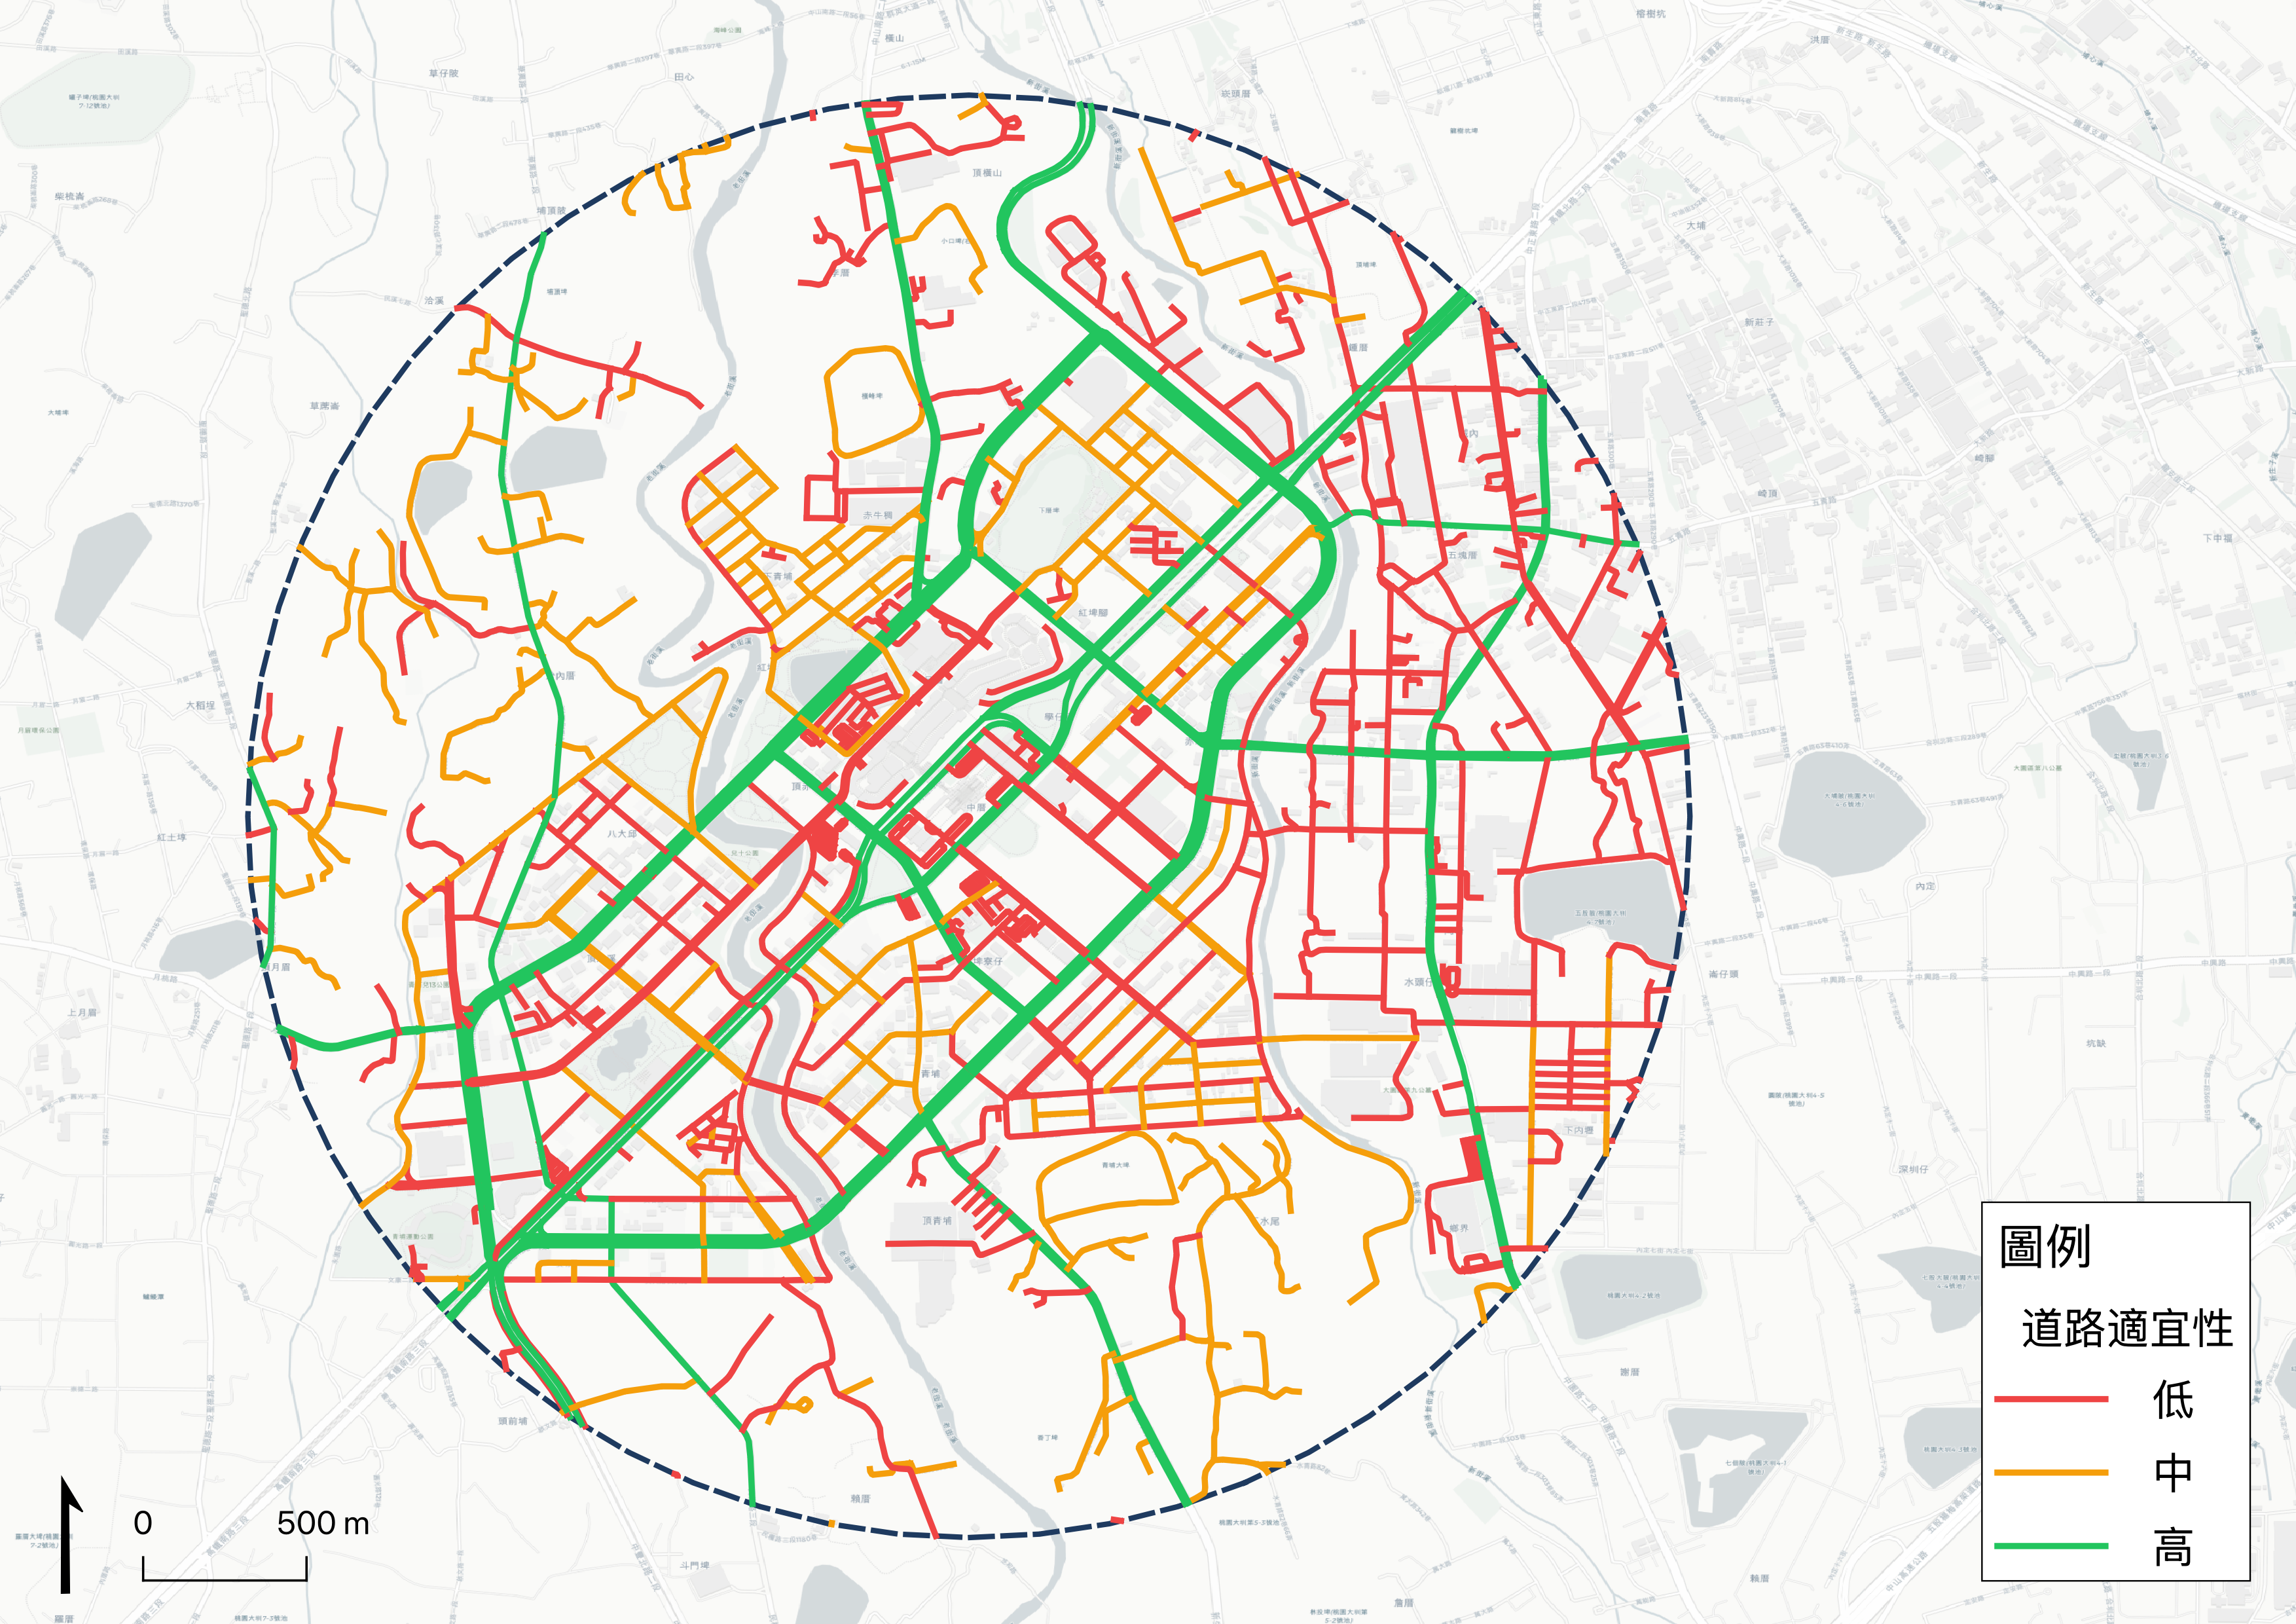
Road class, lane count, speed limits and signalisation are assessed against the operational design domain (ODD) to score each road's suitability.
1,075 roads assessed
Road suitability
Route design
Step 4 — Design the options
What should be implemented, and in which phases?
Three shuttle routes are designed from the gap locations and suitable roads. Each starts at the nearest rail station and forms part of a phased implementation strategy.
3 routes for phased implementation
Analytical method

Multiple open datasets and GIS techniques support a systematic assessment of autonomous shuttle feasibility.

Data sources

Data typeSourceCount
Bus stopsOpenStreetMap / Overpass API74 stops within the core area
Road networkOpenStreetMap15,744 road segments
POI DemandOpenStreetMap Overpass API1,802 residential and employment POIs
Administrative village boundariesOpenStreetMap(admin_level=9)13 villages
Airport MRT stationsOpenStreetMap3 stations
Basis for the 400m walking-distance assumption ▾
Country / organisationStandard
United States FTA400m (1/4 mile)
United Kingdom CIHT400m
Japan Ministry of Land, Infrastructure, Transport and Tourism300-500m
Taiwan Ministry of Transportation and Communications400m

Sources: TCRP Report 165 (2013), FTA Circular 4702.1B (2012), UK CIHT Planning for Walking (2015), Japan Handbook on Urban Structure Assessment (2014)

Analysis workflow

1
Data collection — obtain bus stops, roads and population data through the Overpass API and government open-data portals
2
Service-area analysis — create a 400 m buffer around each stop and calculate the covered area
3
Gap identification — divide the core study area into 200 m grid cells and identify uncovered service gaps
4
Road suitability scoring — assess road suitability using classification, width and speed limits
5
Demand validation — overlay residential and employment POIs on service gaps to assess potential transport demand
6
Route design — design three shuttle routes from gap clusters and the road network, each connecting to the nearest rail station

Road requirements for autonomous buses

Autonomous buses require suitable road infrastructure. The following indicators and reference criteria guide the assessment.

The operational design domain (ODD) considers lane width, intersection complexity, speed limits and gradients. This study expresses these factors as suitability scores from 1 to 5 to screen potential corridors.

Expand the technical specification comparison ▾
ItemMinimum requirementReference standard
Lane width≥ 3.0mAASHTO Green Book
Intersection type≤ 4 intersection arms; signal-controlledEU INFRAMIX Project
Operating speed15 – 25 km/hInternational autonomous-bus trial experience
Gradient≤ 10%NACTO Urban Street Design Guide
Pavement qualityIRI < 4.0 m/kmFHWA pavement-condition indicators
Road-marking retroreflectivity≥ 100 mcd/m²/luxFHWA MUTCD

Analysis results

Quantified coverage and service gaps within the core study area.

77.9%
Service coverage within 400 m
22.1%
Share of area with a service gap
4 stops
Suggested new stops
15.1%
Gap share after the proposed improvement

Service-gap analysis

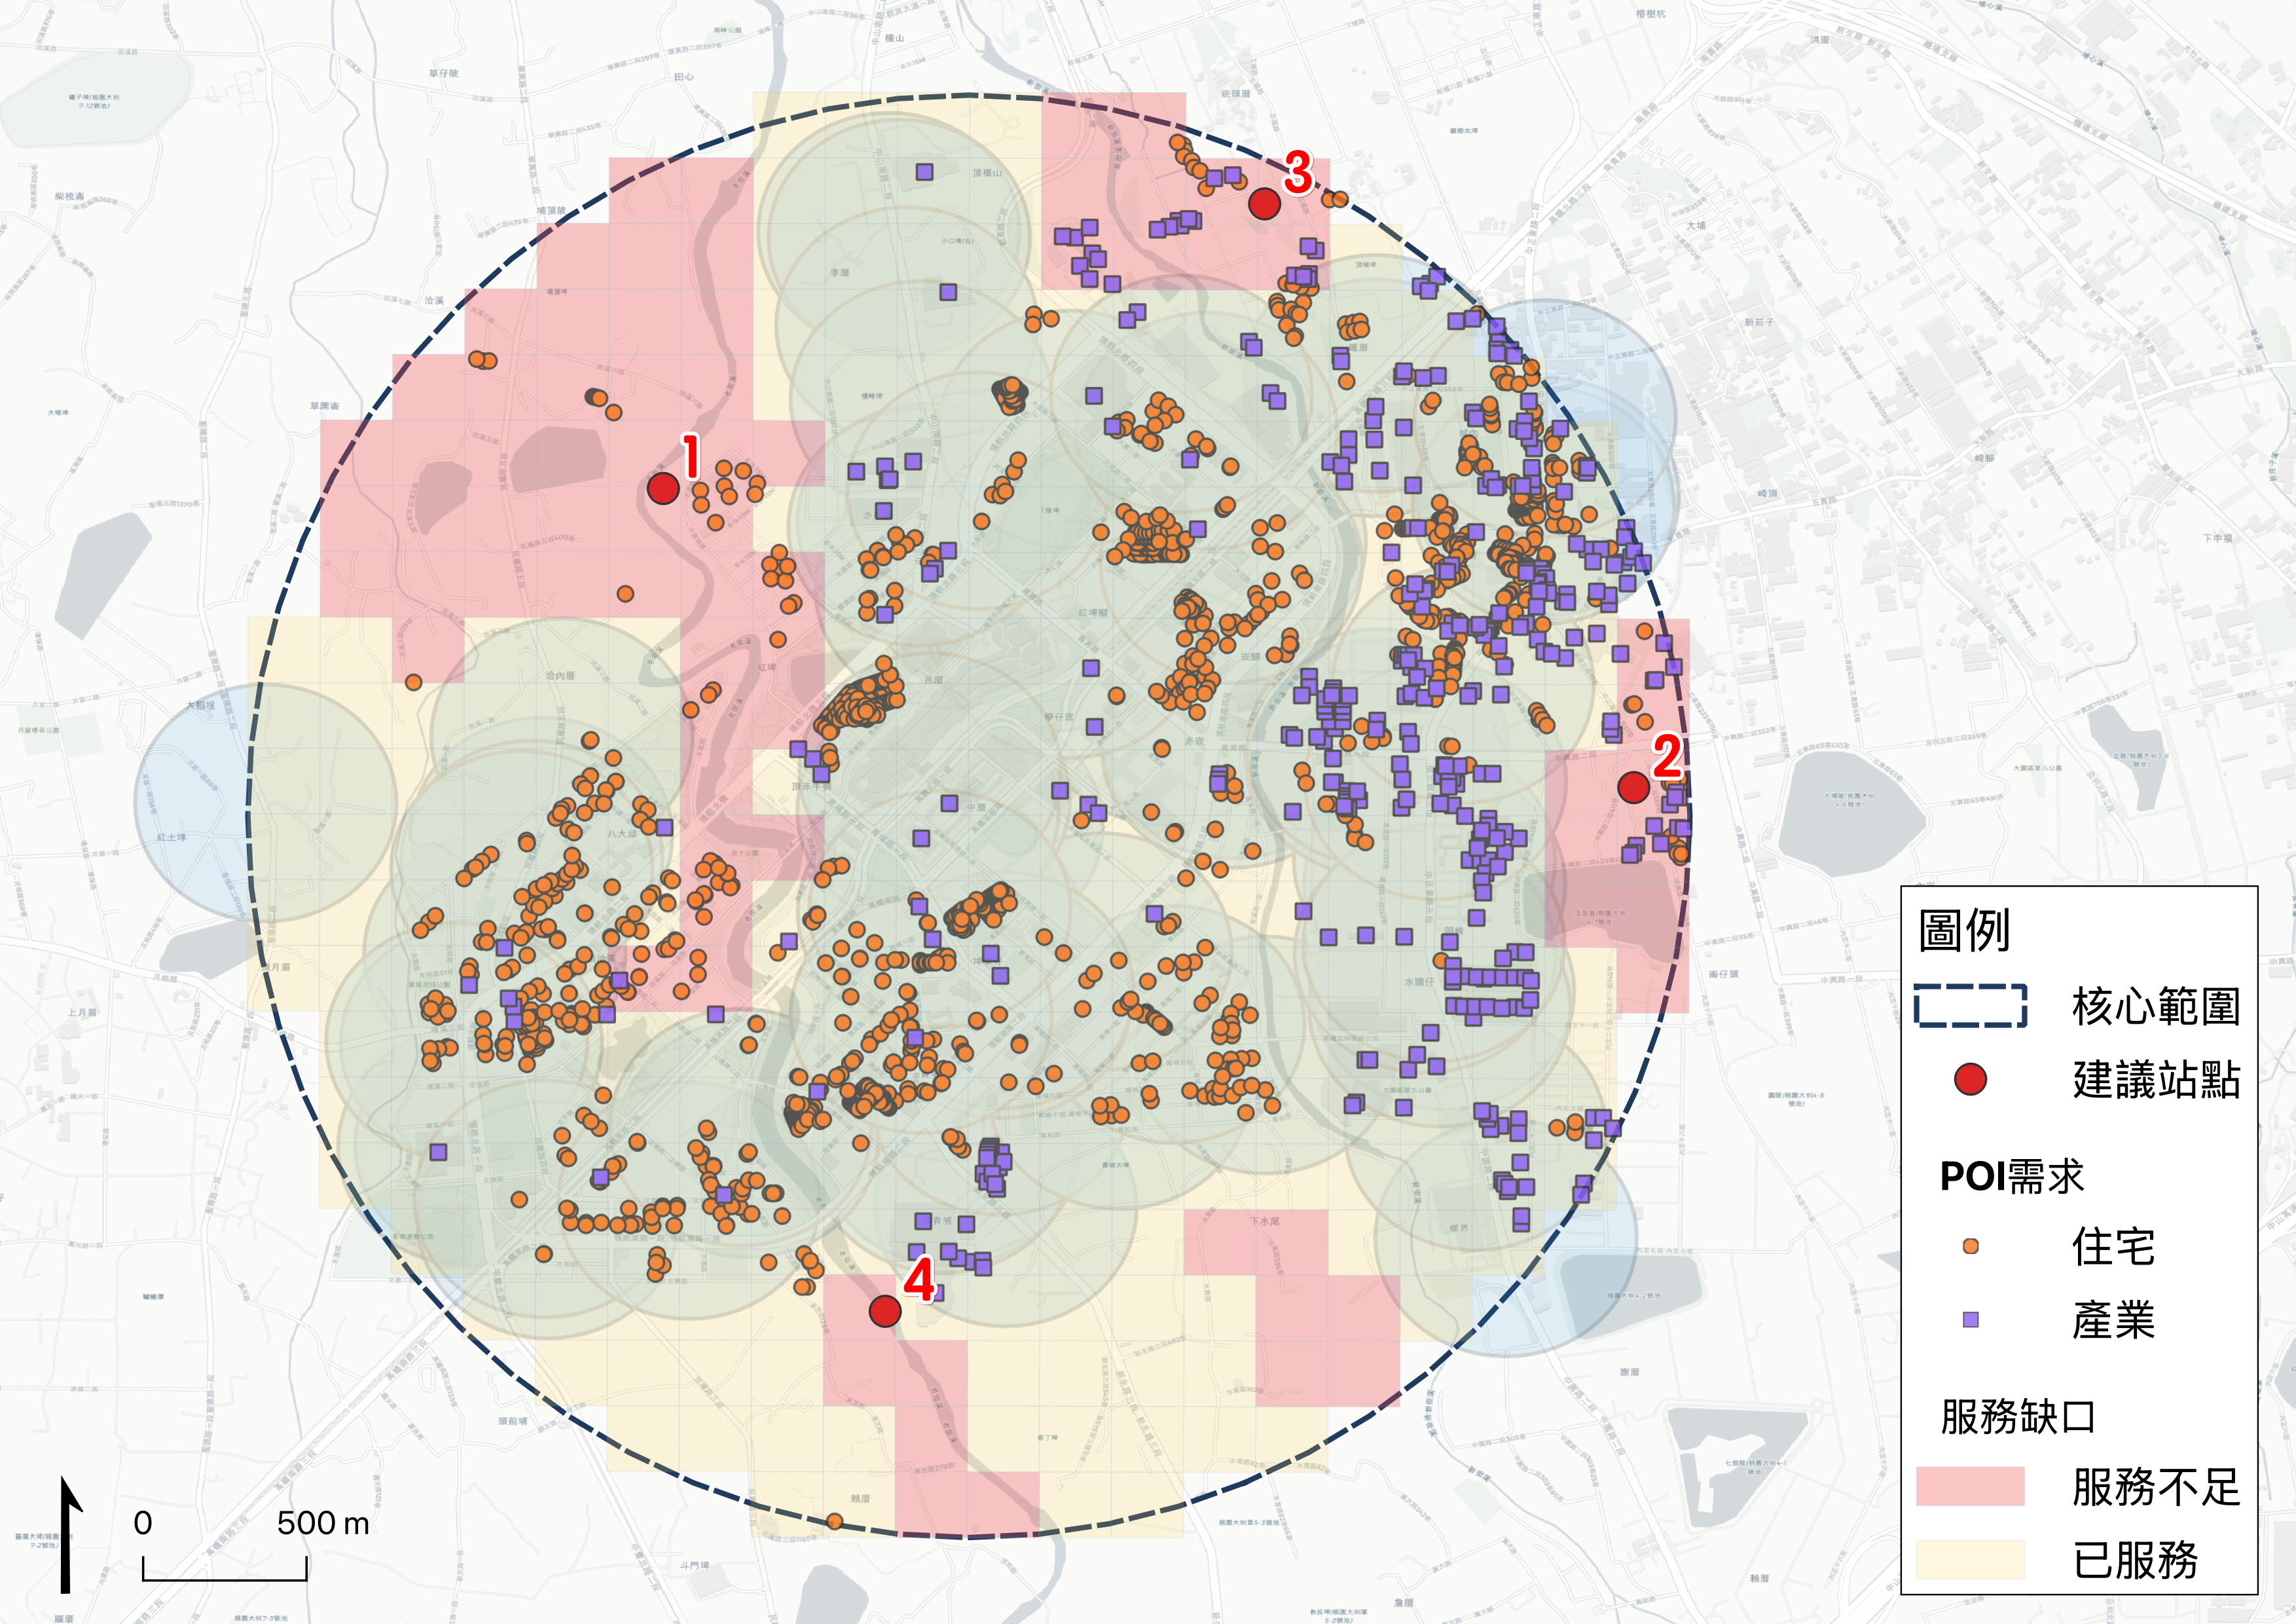
The core area is a 2km-radius circle around Taoyuan HSR Station. The 400m buffers of 74 bus stops cover 77.9%. Of 344 cells in the 200m grid, 76 (22.1%) are uncovered. Gaps are concentrated in the northwestern, eastern and southern parts of the area.

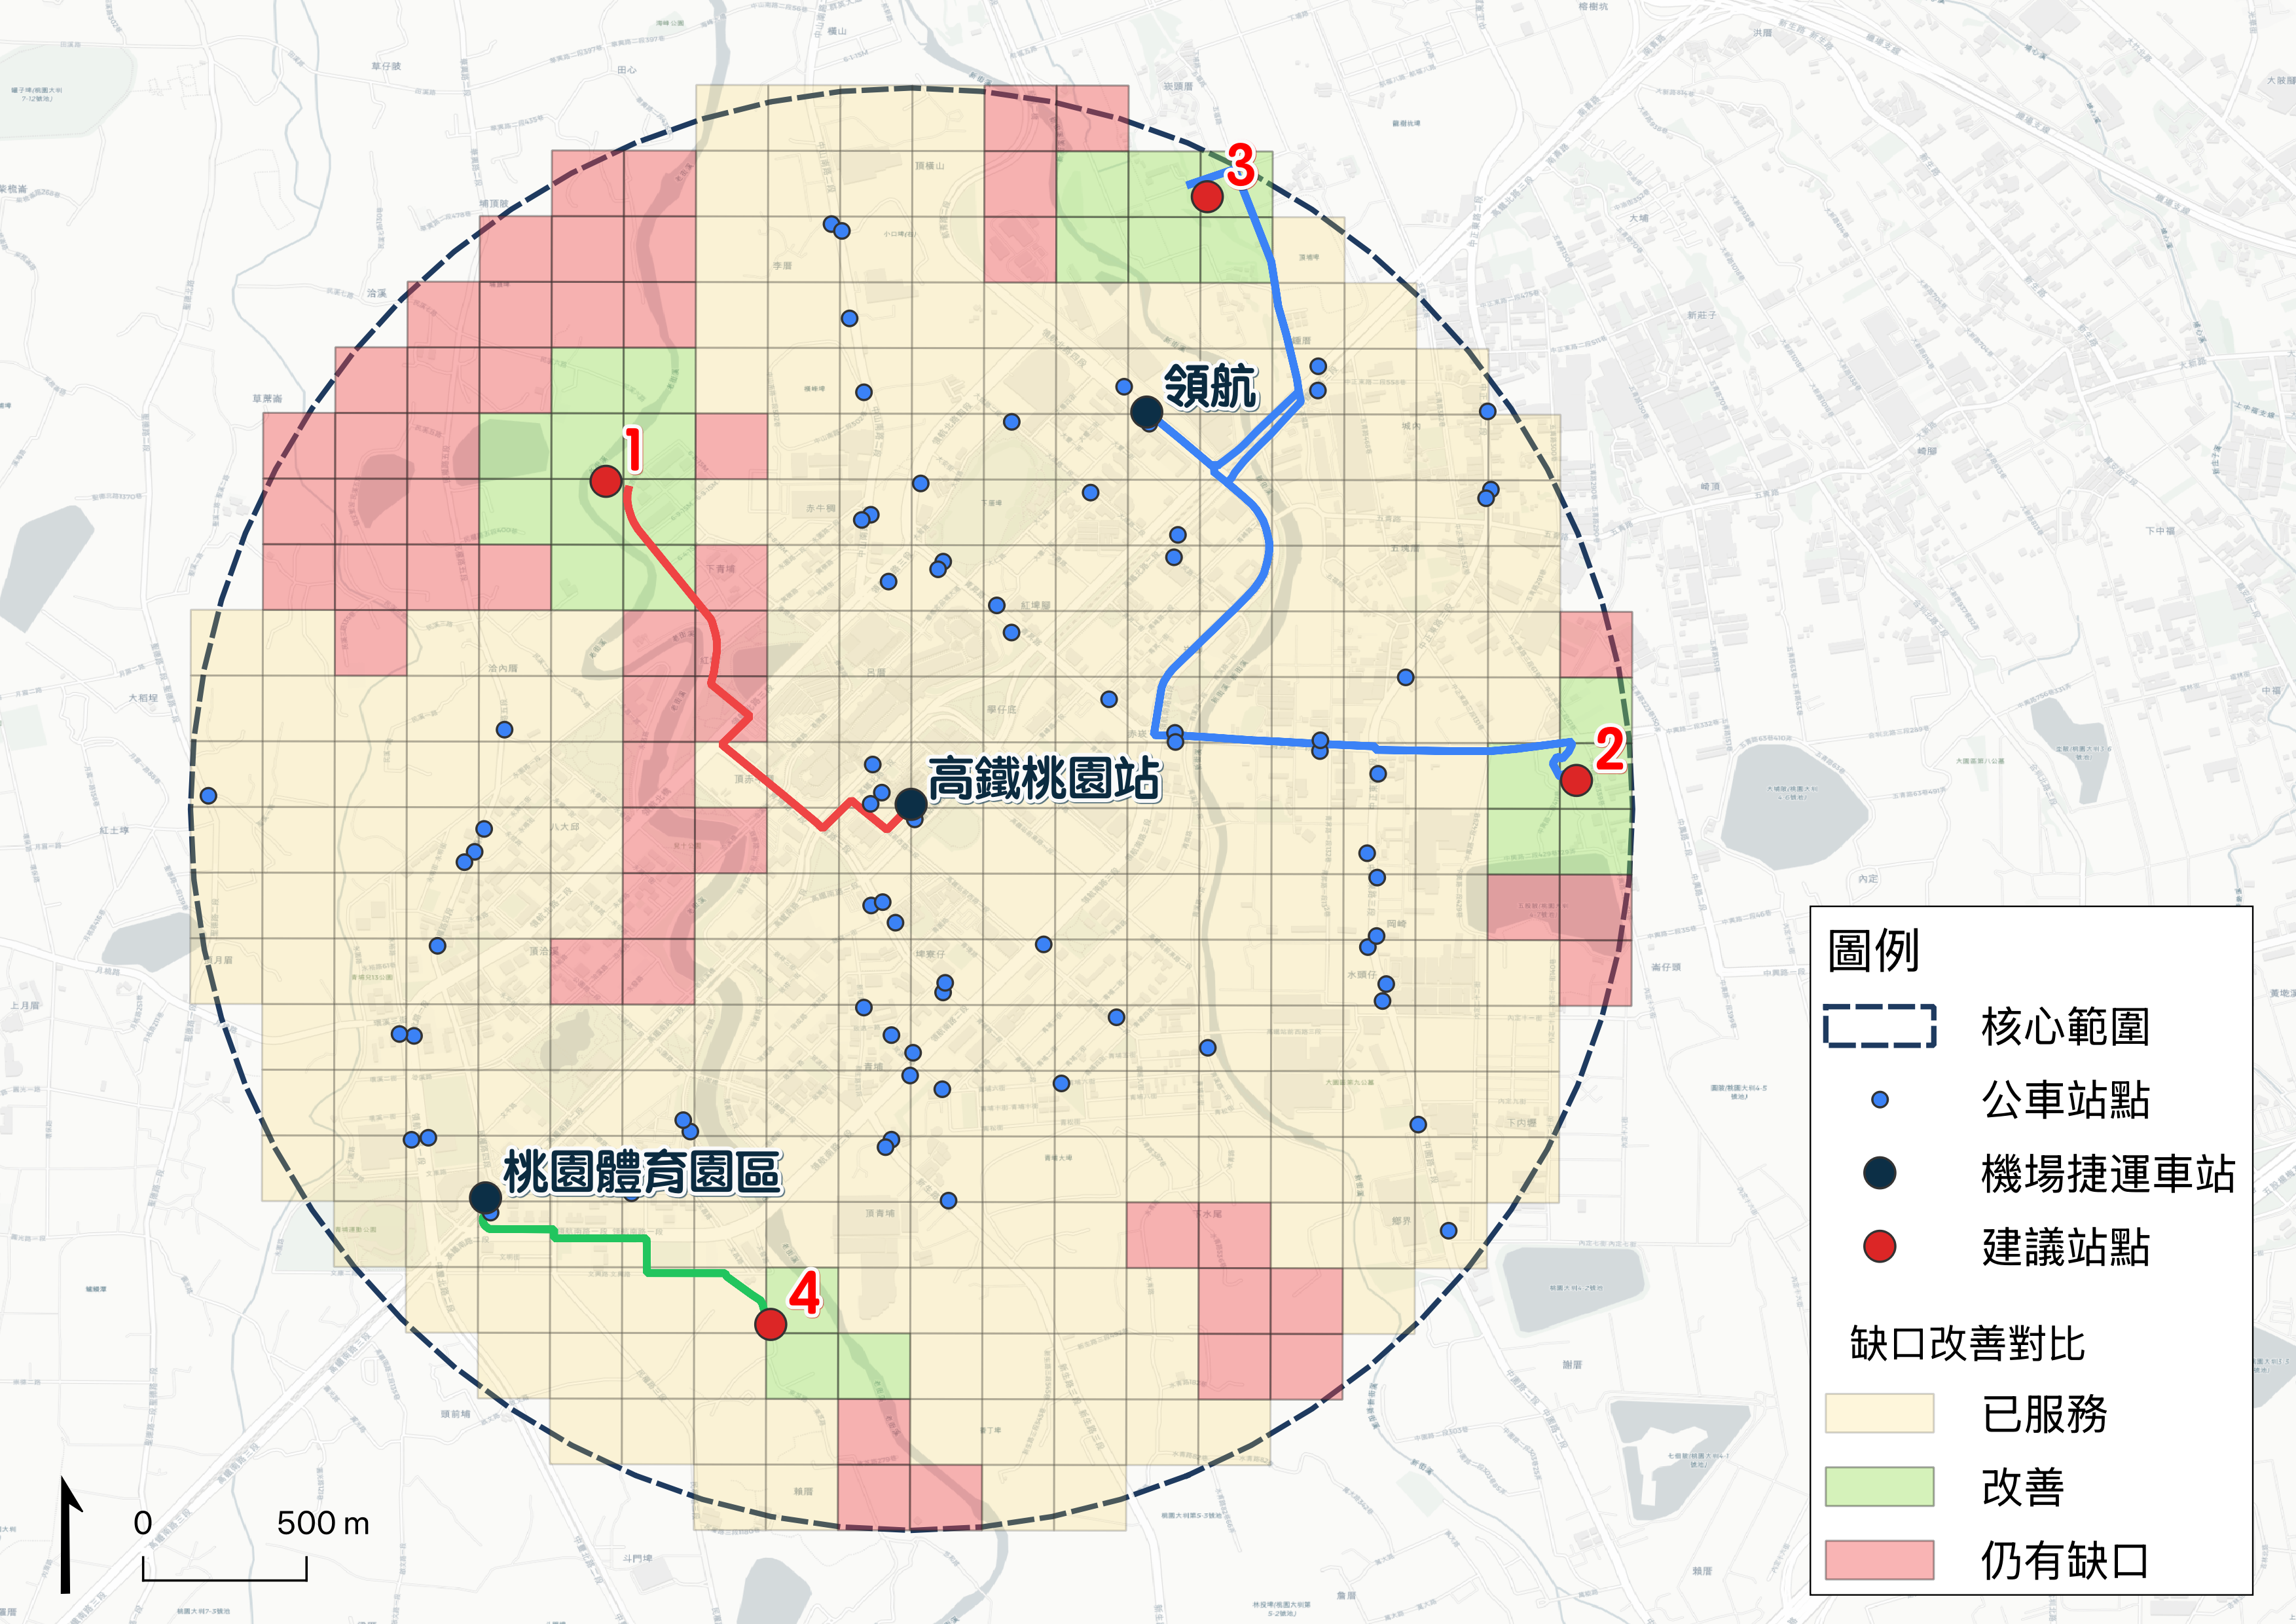
POI-weighted demand analysis identifies residential communities and employment destinations within 4 gap clusters. Stop locations are shifted towards the weighted demand centres. Under the study's coverage assumptions, adding the stops reduces the gap share from 22.1% to 15.1%.

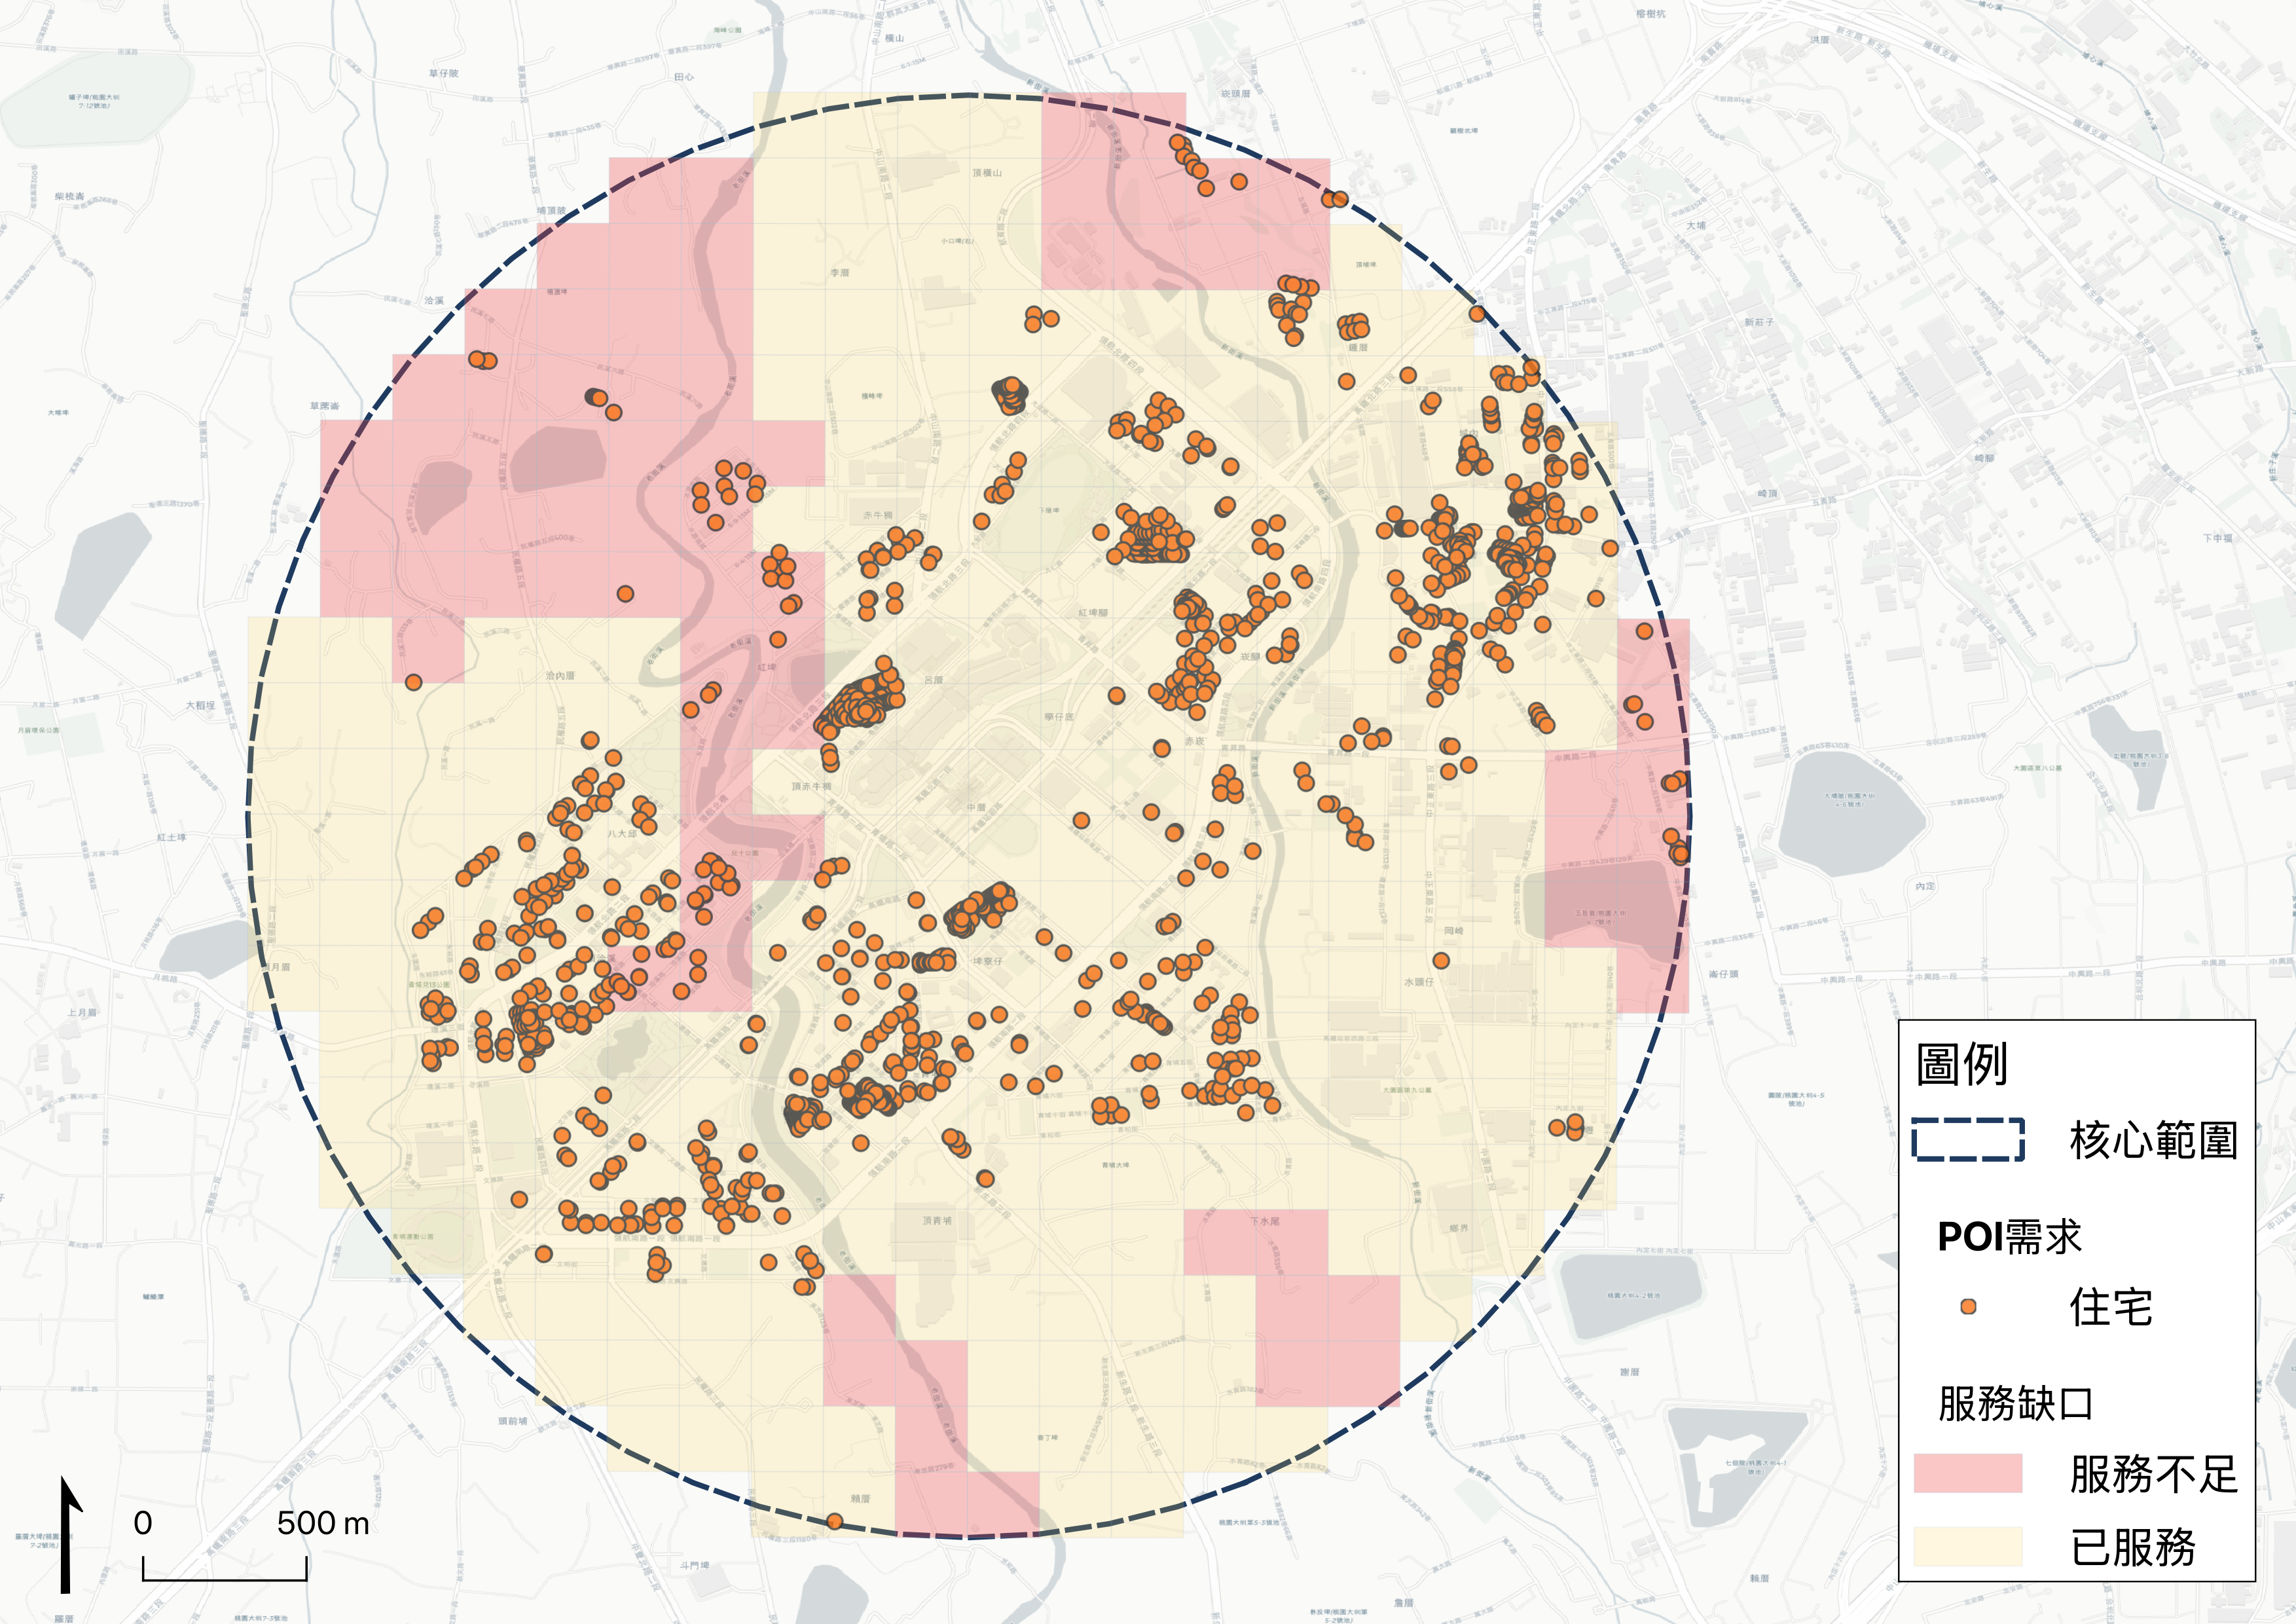
Service gaps overlaid with POI demand

Figure: service gaps overlaid with POI demand

Road suitability assessment

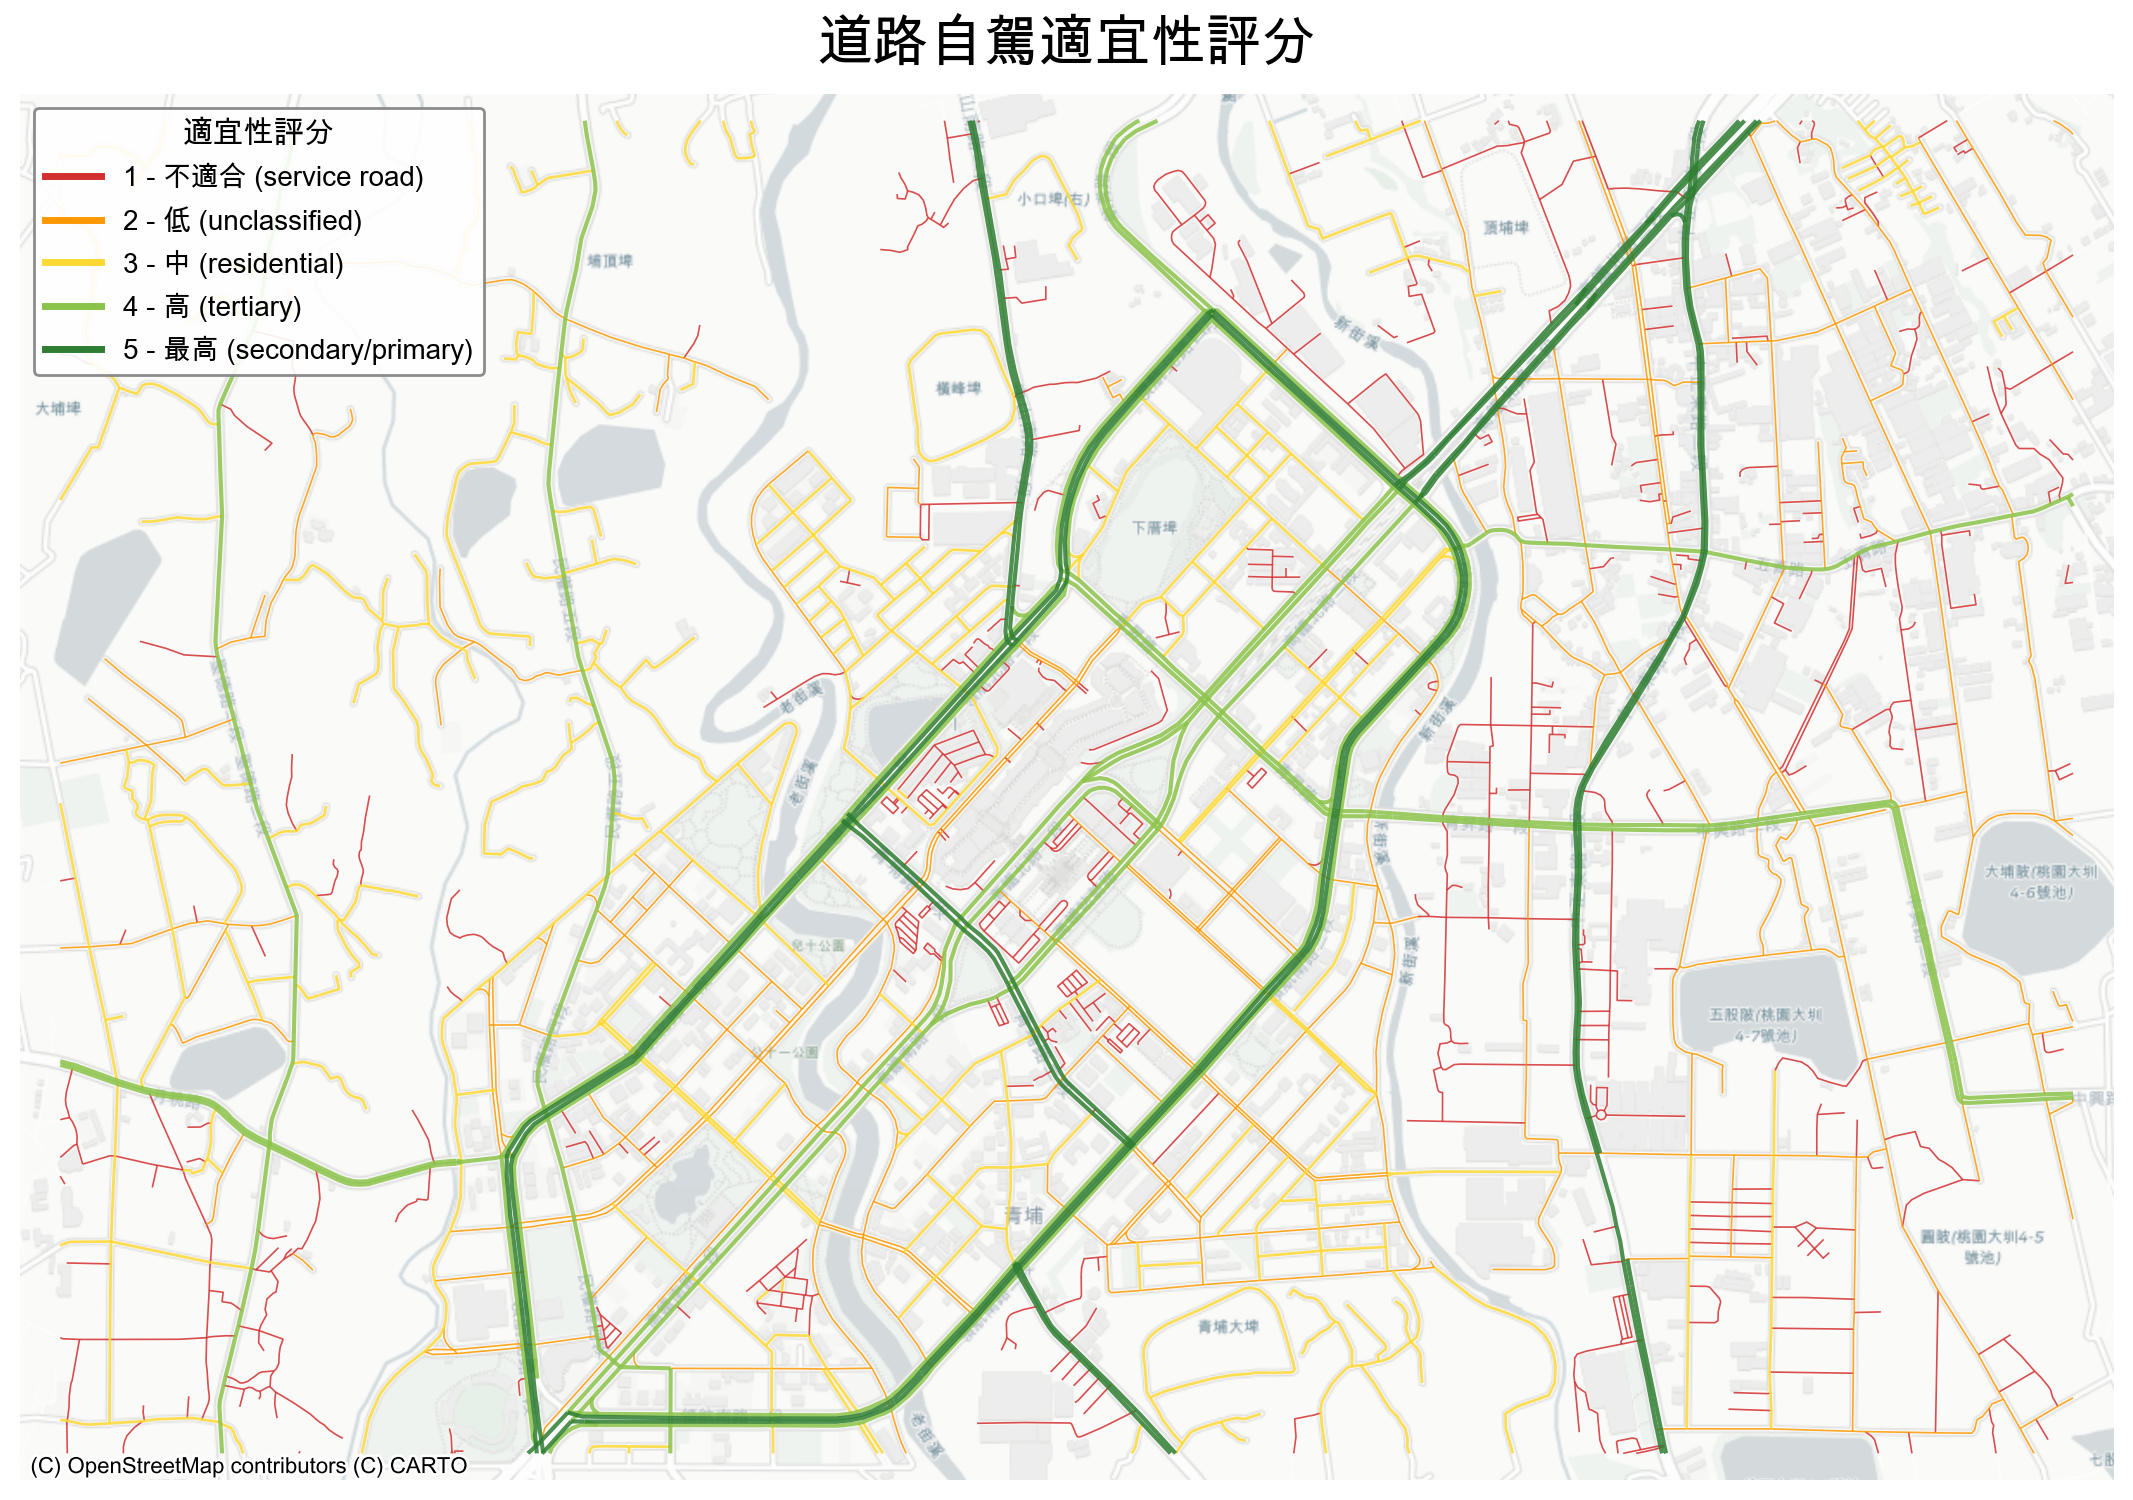
The 1,075 candidate roads in the core area receive ODD suitability scores from 1 to 5 based on road class, estimated width and speed conditions. Of these, 233 lie near service gaps and are considered as potential shuttle-route segments.

Scoring itemConditions associated with a higher score
Road classificationsecondary, tertiary, residential
Width≥ 3.0 m (for safe autonomous-vehicle operation)
Speed limit15–50 km/h, a low-speed environment
Proximity to a gapWithin 200m of a service gap
Road suitability scores

Figure: road suitability scores (red = low, yellow = medium, green = high)

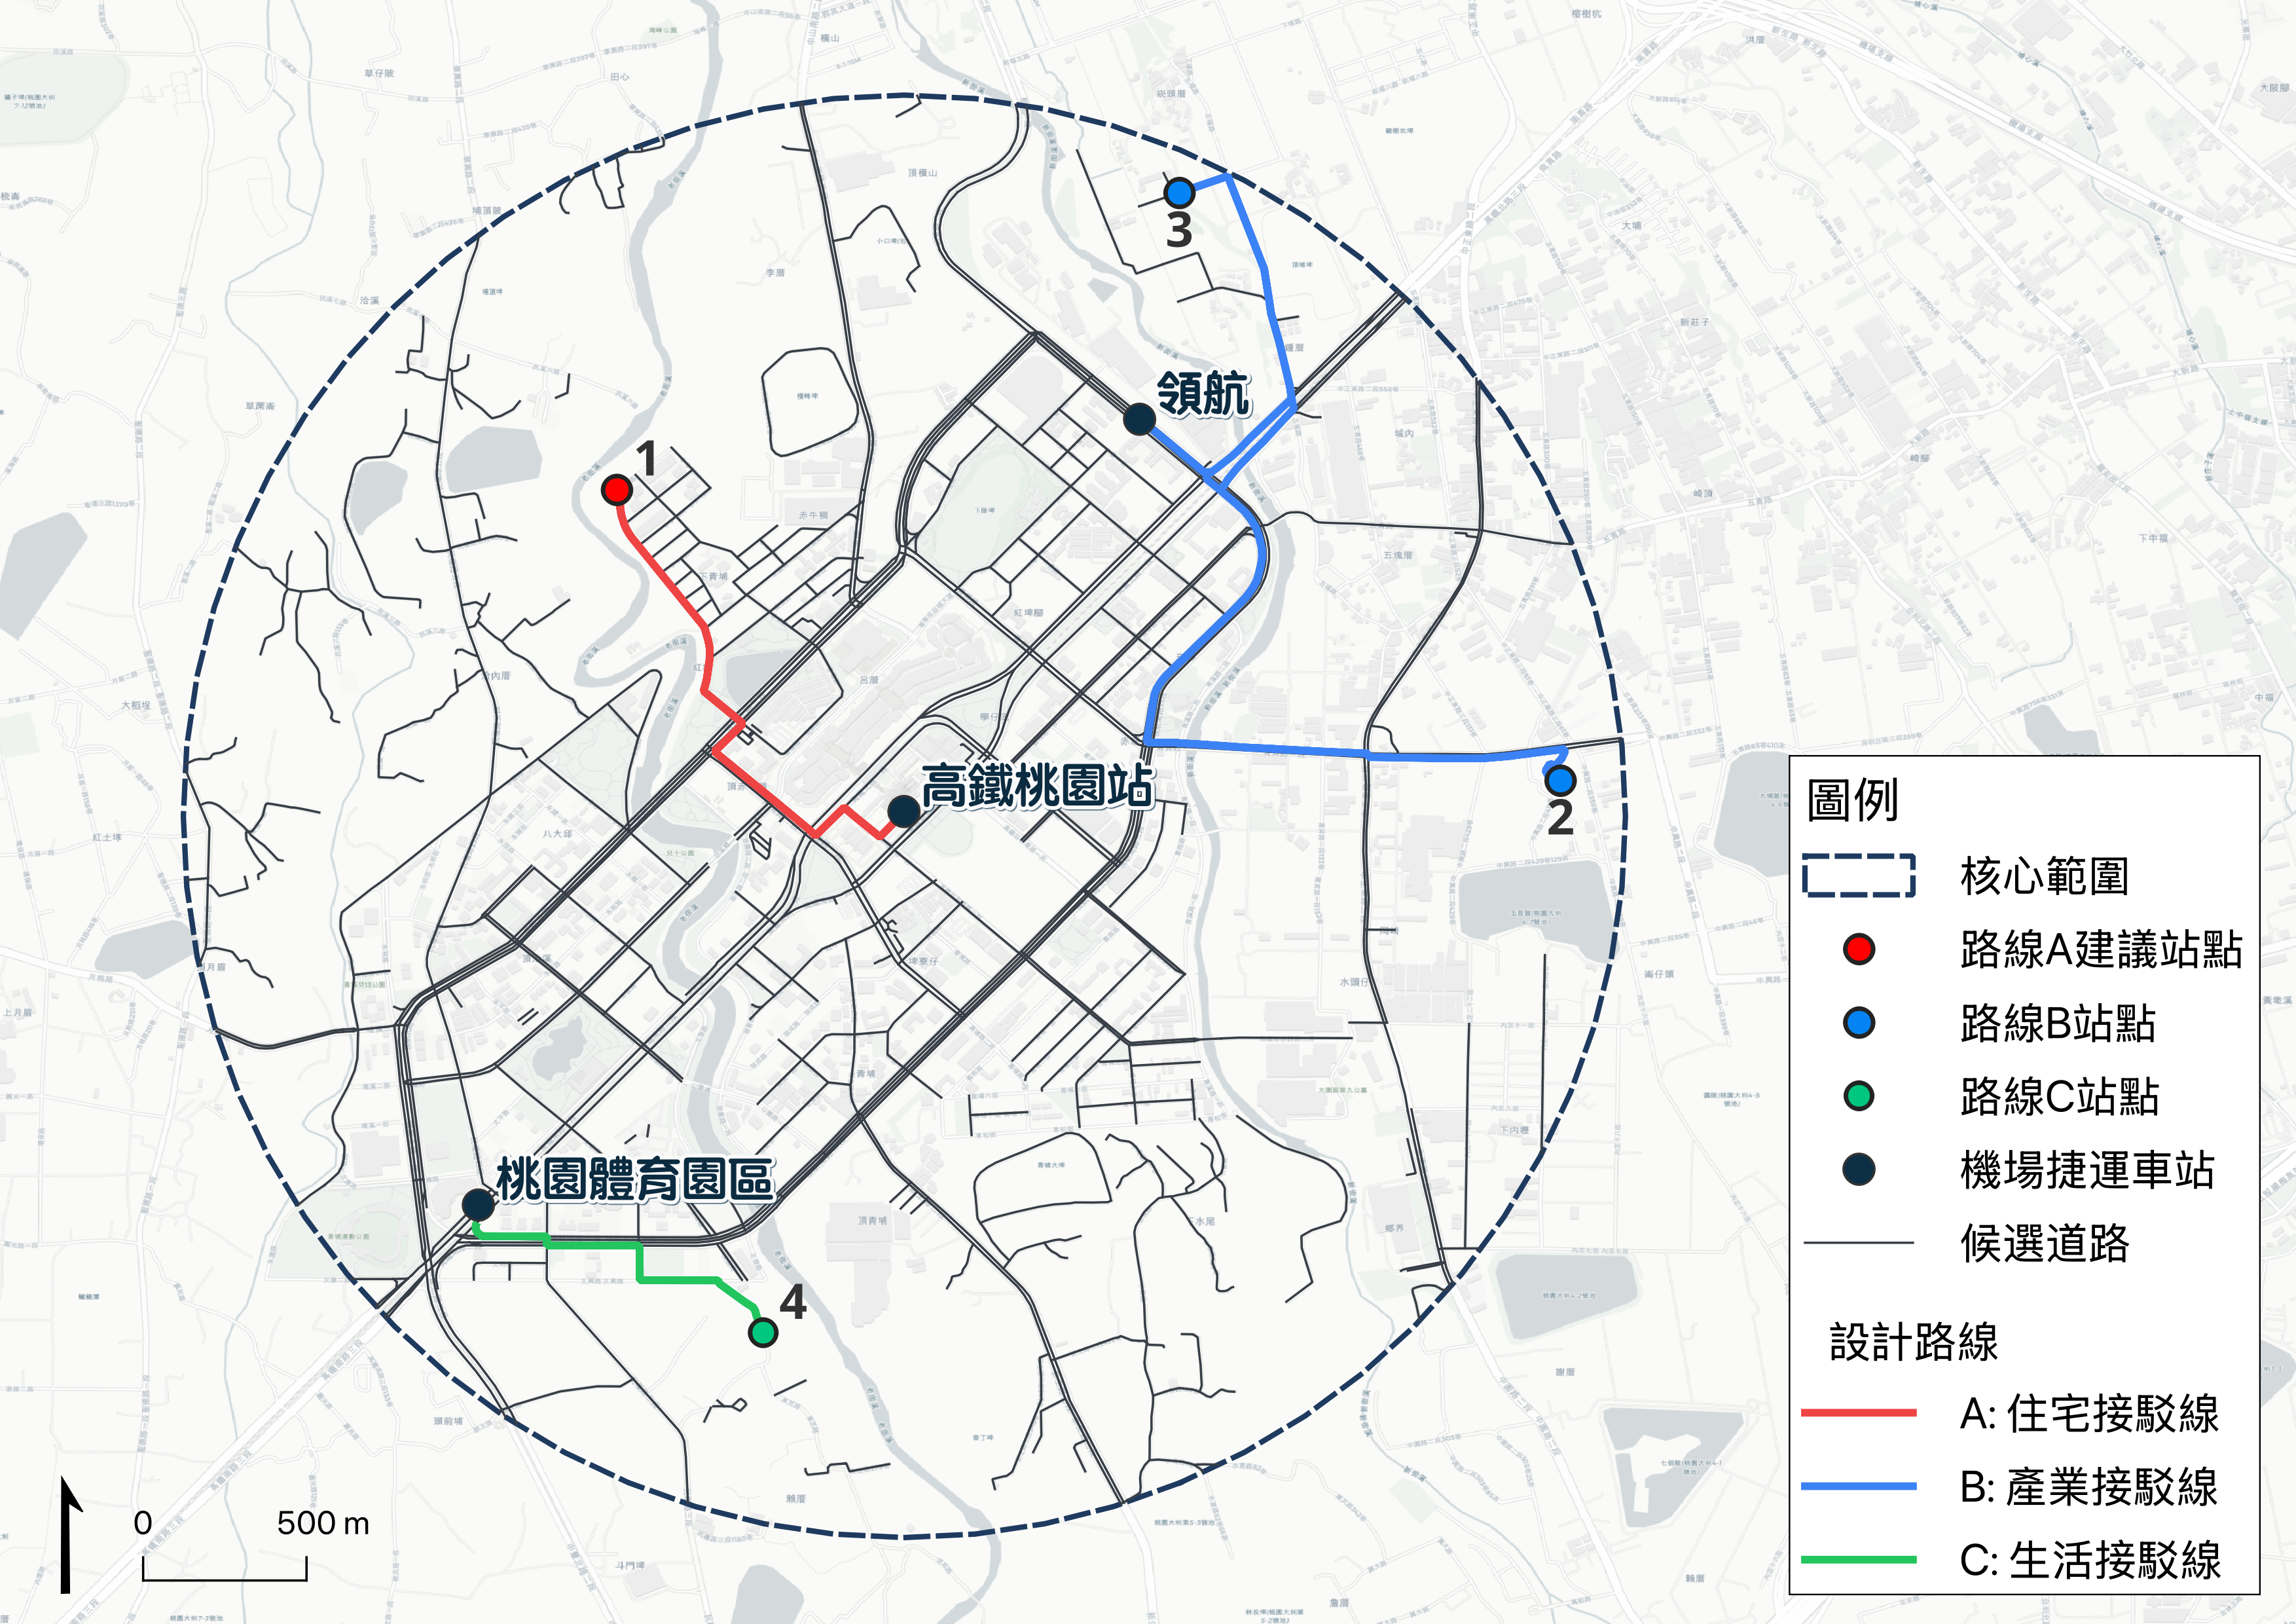
Proposed routes and candidate roads

Figure: proposed routes overlaid on candidate roads

Shuttle route design

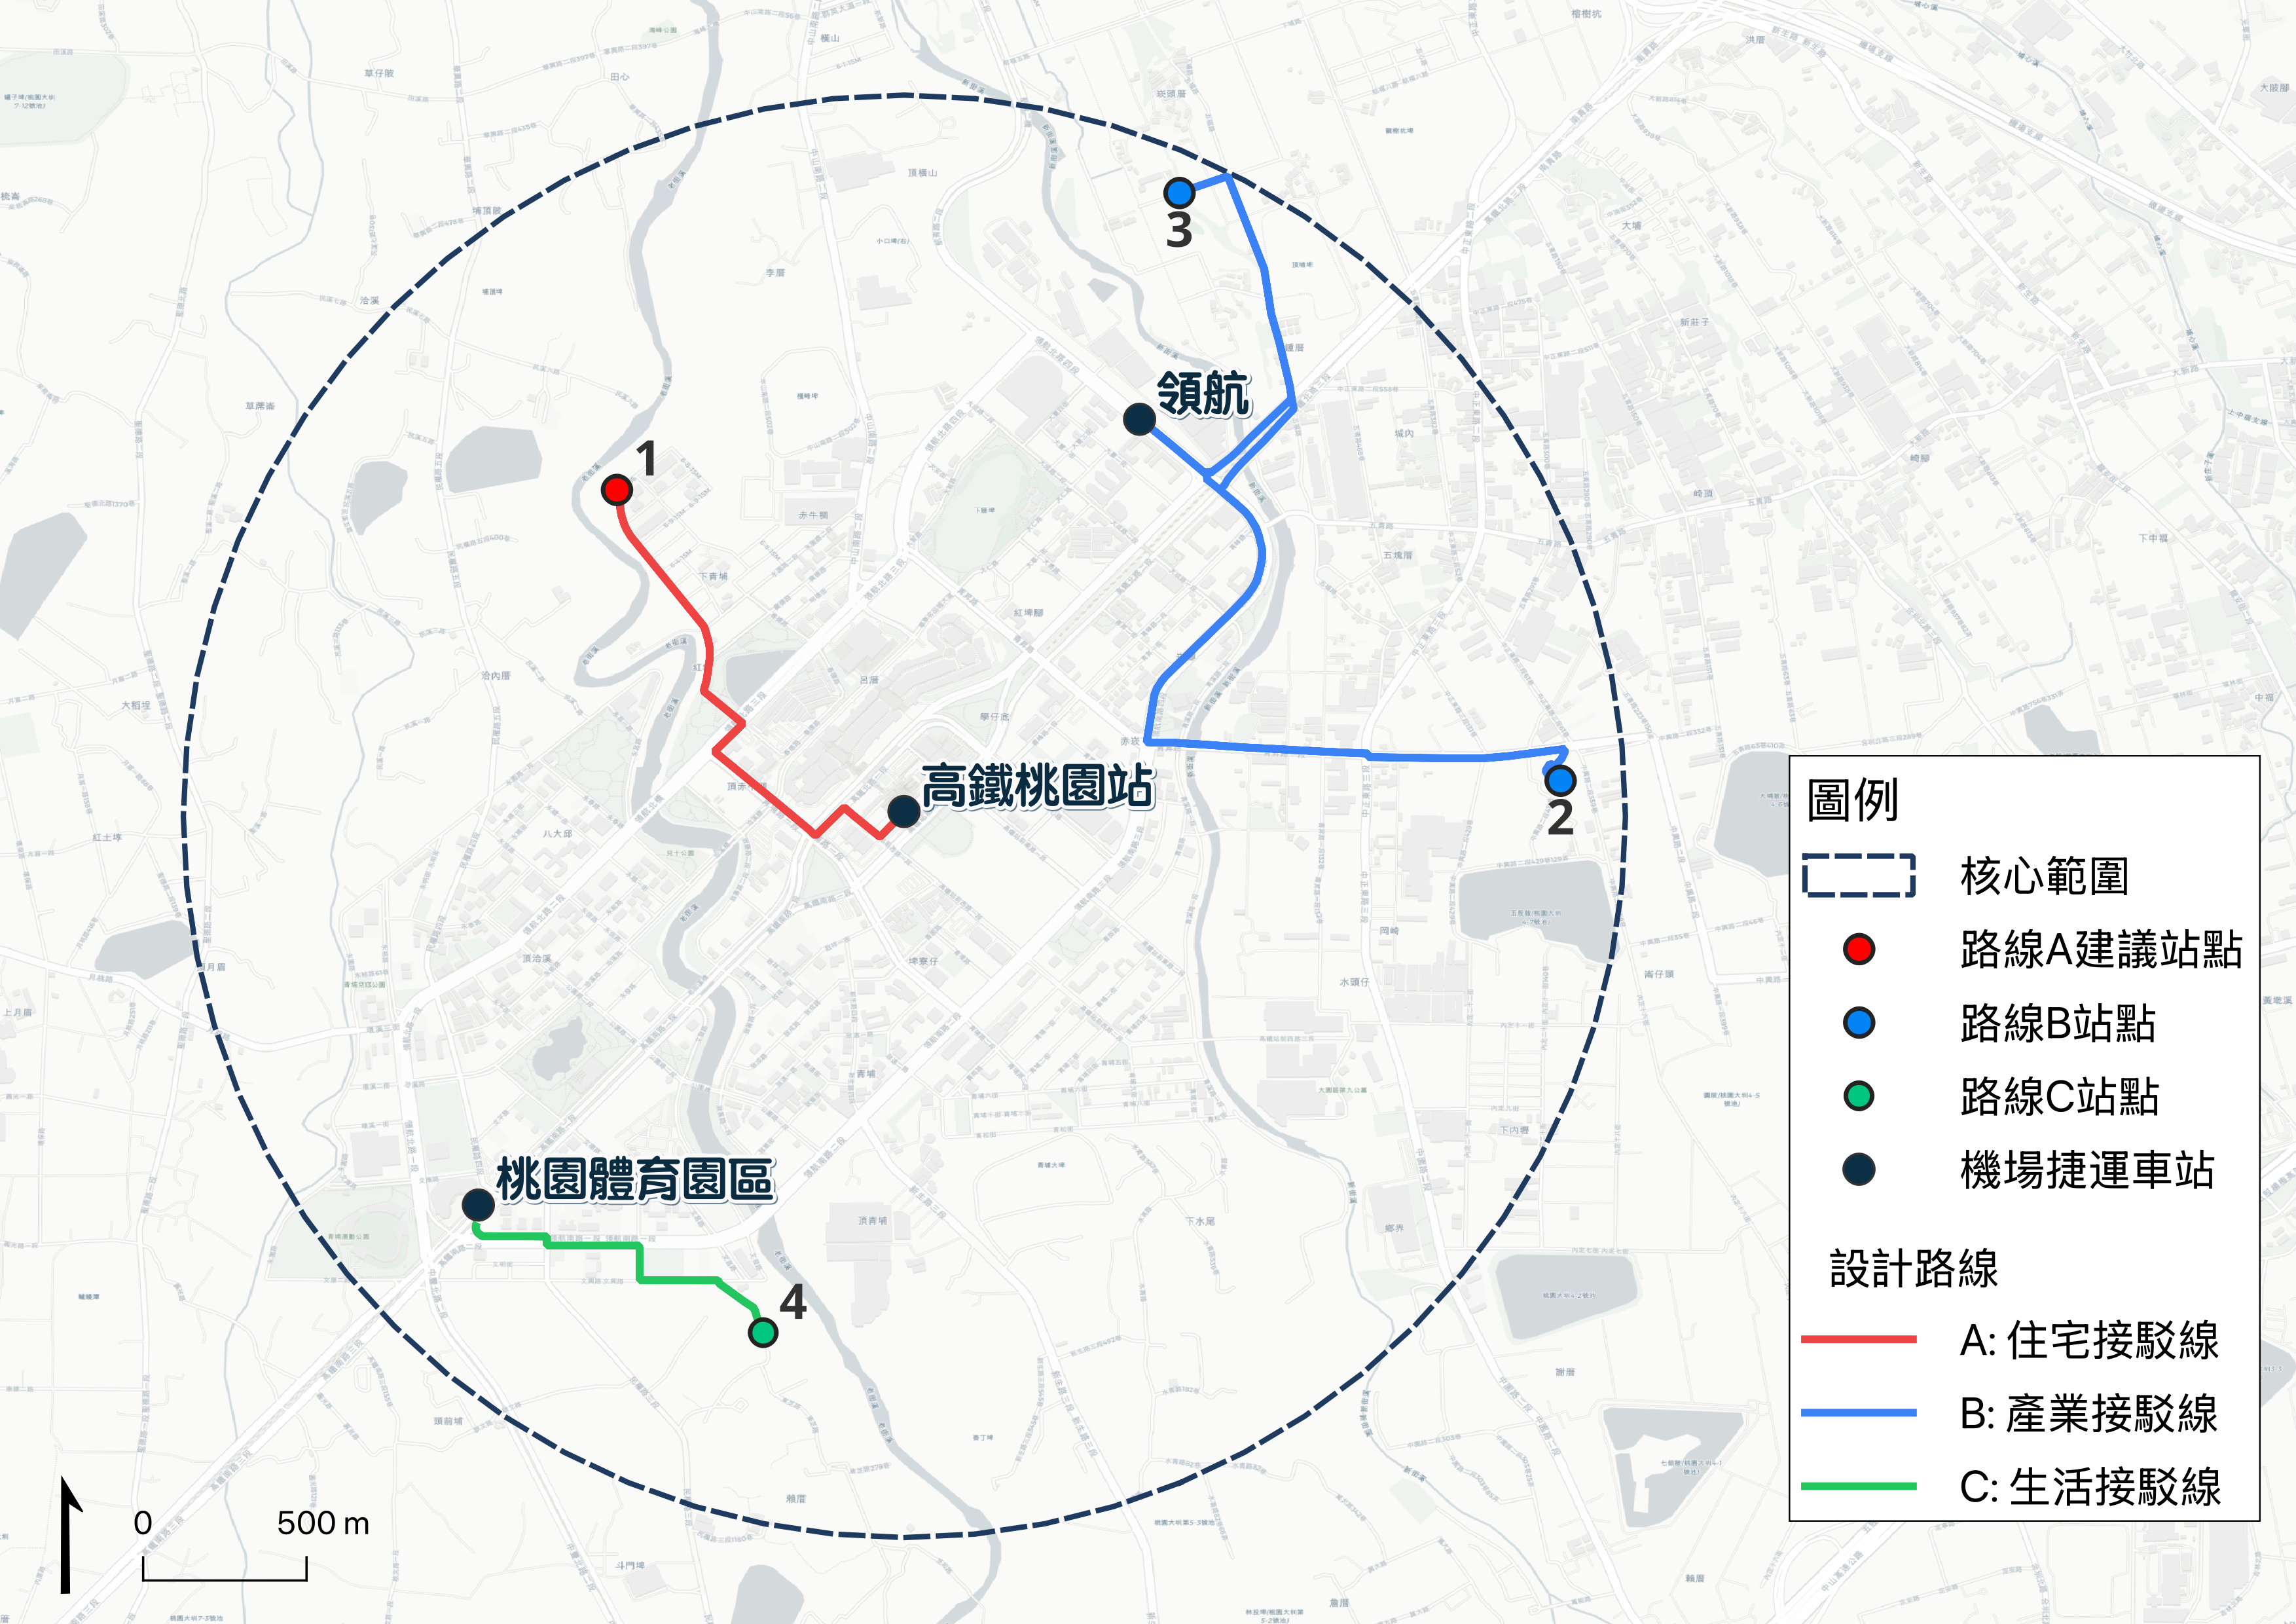
Three shuttle routes are designed around the 4 gap clusters and POI-weighted stop locations. Each starts and ends at the nearest rail station and connects proposed stops in the uncovered areas.

A: Residential shuttle

3.35 kmDistance
Taoyuan HSR StationTerminal

Service gap #1 — connect HSR commuters with northwestern residential communities, including Baolai Garden and Prague Spring.

B: Employment shuttle

7.49 kmDistance
Linghang StationTerminal

Service gaps #2 and #3 — connect Linghang Station with eastern employment areas, including Dajiang Industrial Park and the 3M logistics center, and northern residential areas.

C: Local amenities shuttle

2.09 kmDistance
Taoyuan Sports Park StationTerminal

Service gap #4 — connect Taoyuan Sports Park Station with newer communities to the south and the Qingtangyuan recreation area. The compact route is suited to a low-demand neighborhood shuttle.

Comparison itemA: Residential shuttleB: Employment shuttleC: Local amenities shuttle
Route length3.35 km7.49 km2.09 km
TerminalTaoyuan HSR StationLinghang StationTaoyuan Sports Park Station
Service gap#1#3, #2#4
Primary demandCommuting homeCommuting to workEveryday travel
Service roleHSR commuter connectionIndustrial-area shuttleCommunity shuttle
Proposed implementation orderPhase 1Phase 2Phase 3
Phasing strategy: Route A (3.35km) is prioritised as the HSR-connected demonstration route. Route B would then serve industrial-area commuting demand after operational validation of A. Route C is the shorter community connection (2.09km), introduced alongside area development.
Three proposed shuttle routes

Figure: three proposed shuttle routes (red = A, blue = B, green = C)

POI demand validation

Residential and employment POIs are overlaid on each service gap to assess the demand supporting the proposed shuttle routes.

Demand data

The historical OpenStreetMap Overpass query returned 1,802 POIs in the core area, classified into residential (1,418) and employment (384) categories. A POI-weighted location algorithm shifts proposed stops towards concentrations of demand, rather than simply using gap centroids.

StopPOIs within 800mDisplacementAssociated route
#132237mA: Residential shuttle
#2184231mB: Employment shuttle
#3172130mB: Employment shuttle
#438339mC: Local amenities shuttle

Note: stop locations combine 70% of the demand-weighted centre with 30% of the geometric gap centroid, targeting locations with both a coverage gap and demand. OSM POIs are incomplete; actual demand may be greater.

Residential POIs: orange circles show residential communities

Figure: residential POI distribution (layers: service gaps + residential POIs)

Employment POIs: purple squares show employment facilities

Figure: employment POI distribution (layers: service gaps + employment POIs)

Expected coverage improvement

With 4 proposed autonomous-shuttle stops, the modelled share of uncovered area decreases under the study's assumptions.

22.1%
Gap share before the proposal
→
15.1%
Gap share after the proposed improvement
Modelled change: a 31.6% reduction in the gap — under the proposed-stop assumptions, 24 of 76 gap cells become covered (green); the three proposed routes have a combined corridor length of 12.93 km.
Service-gap comparison: green areas show additional modelled coverage

Figure: before / after coverage comparison (layer: gap improvement after proposed stops)

Interactive map

An interactive analysis map with zoom and selectable layers for stops, buffers, gaps, road scores and proposed routes.

Implementation strategy and indicative schedule

Moving from analysis to implementation requires coordination between organisations and phased delivery.

Stakeholders

OrganisationRole
Taoyuan Department of TransportationRoad-use approval and integration with the bus network
Ministry of Economic Affairs autonomous-vehicle programme officeContact point for the regulatory sandbox application
Dayuan District Office / village officesLocal engagement and coordination with residents
Autonomous-vehicle suppliers, such as QinweiHD-map surveying and vehicle deployment
Railway authority / Taoyuan MetroConnections and transfers at stations
Nearby commercial destinations, including Gloria Outlets and IKEAWaiting-area provision and travel demand

Key risks

RiskResponse strategy
Uncertain regulatory review timetablePrepare application documents early and establish contact with the responsible authority
Concerns among local residentsBuild trust through meetings with village leaders and trial rides
Road works affecting the routesProvide alternative road segments and retain route flexibility
Differences between GIS analysis and site conditionsInclude a field survey and validation phase

Indicative project schedule

Task M1M2M3M4M5M6 M7M8M9M10M11M12
Field survey and validation
Site validation
HD-map surveying
LiDAR scanning
Stakeholder coordination
Road-use coordination
Regulatory application
Regulatory sandbox application
Route A demonstration operation
Trial operation and KPI collection
Expansion to Routes B and C
+

The proposal prioritises Route A (3.35km) as the HSR-connected demonstration route, followed by B and the shorter 2.09km community route C after operational validation. Under the proposed-stop assumptions, the modelled service-gap share changes from 22.1% to 15.1%.

References

Academic literature, technical standards and data sources cited in this study.